Six months before Americans vote in the November midterms, Wall Street is already pricing in the outcome. Congress may look very different by year-end — and so might your portfolio, your mortgage rate, your healthcare costs, and the tax code that governs your business. Elections don’t just pick politicians. They set the rules of the economic game for the next two years. In 2026, with oil above $100, inflation still running hot, and the Federal Reserve frozen between competing pressures, those rules matter more than usual.
The Big Picture: Why 2026 Is Different
Every midterm election reshapes the legislative landscape. The president’s party almost always loses ground — it has happened in 20 of the past 22 midterm elections stretching back to 1938. What makes 2026 unusual is the economic backdrop.
Overall grocery prices have risen 31% since February 2020. Gas is above $4 a gallon for the first time since 2022. 60% of respondents in CNBC’s All-America Economic Survey for Q1 2026 disapprove of President Trump’s handling of the economy. Affordability — housing, healthcare, groceries, fuel — has become the defining political fault line of the cycle.
Republican control of Congress is looking vulnerable ahead of the 2026 midterms, and affordability has emerged as the central campaign issue. The White House is rolling out targeted measures to lower mortgage rates, reduce prescription drug costs, and cap credit card interest rates. Each of those initiatives has direct market implications regardless of who wins.
The View: This cycle is rare because the economic pain is visible and personal. Voters aren’t debating abstract GDP numbers — they’re angry about gas, groceries, and insurance premiums. That makes the policy response more politically urgent than in typical midterm years, which in turn makes the legislative fallout more consequential for investors.
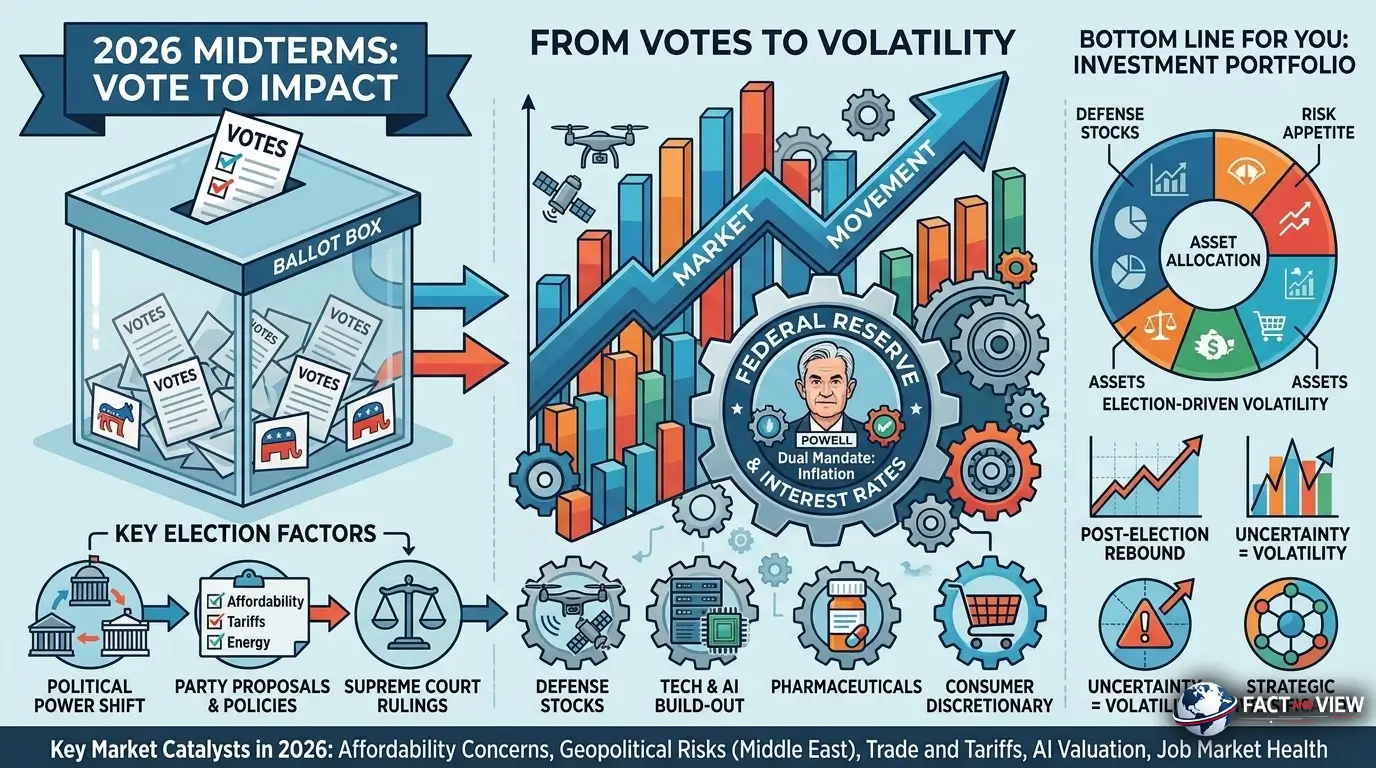
Deep Dive: Four Transmission Channels from Ballots to Balance Sheets
1. The Divided Government Effect
Markets historically prefer policy clarity over political paralysis — but the data complicates that narrative. Performance the year after midterms has tended to be strong regardless of the election outcome. Historically, markets have performed well under single-party rule and different combinations of divided government.
What actually drives post-midterm rallies isn’t which party wins. It’s the removal of uncertainty. Once investors know the composition of Congress, they can price policy risk with confidence.
Fact: The S&P 500 has gained an average of +15.4% one year after a midterm election, going back to 1950, according to Standard & Poor’s data.
Fact: In the 12 months before midterm elections, the S&P 500 has historically delivered weaker results than its long-run norm — an average pre-midterm return of 2.9%, compared with a historical average of 8.9%.
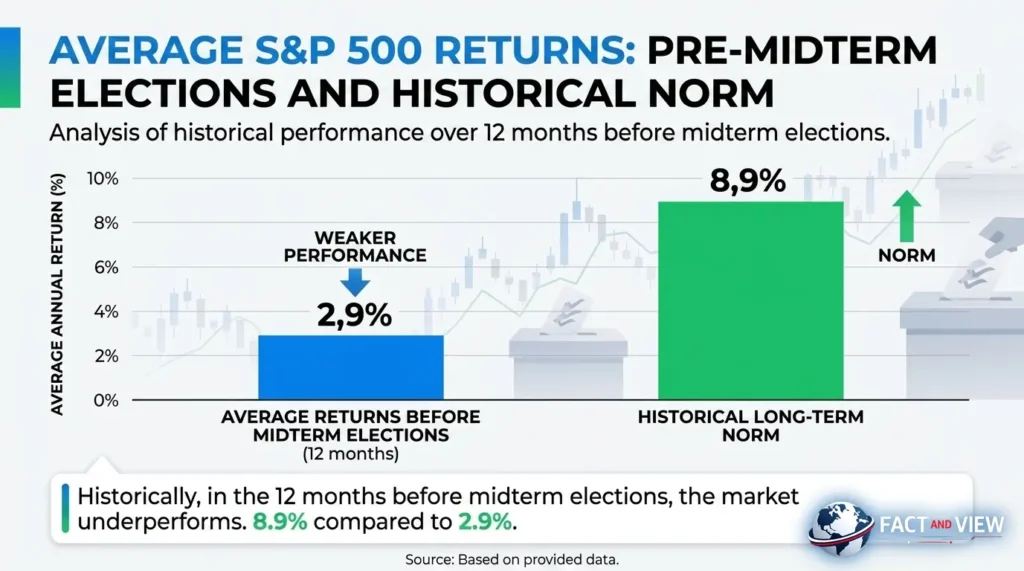
The View: The “pre-midterm drag” is real and rational. It reflects genuine uncertainty about fiscal policy, regulatory direction, and tax treatment. Investors in 2026 are navigating this drag on top of a geopolitical oil shock — a uniquely uncomfortable combination.
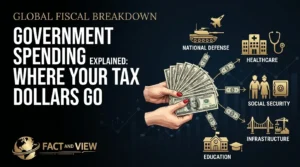
2. Fiscal Policy and the Debt Ceiling
A Democratic-controlled Congress would likely push to restore Affordable Care Act subsidies, expand Medicaid, and roll back some Trump-era tax cuts. A Republican-held Congress would prioritize extending the 2017 Tax Cuts and Jobs Act provisions set to expire in 2027 and pushing further deregulation.
Consumer and healthcare sectors are directly exposed to SNAP and Medicaid changes. But aside from policy, there will likely be noise around debt ceiling fights and government shutdowns — and those things don’t usually derail growth, but they can create volatility and short-term uncertainty, especially around funding deadlines.
Fact: The federal deficit is structurally elevated. No political configuration on the ballot in November solves it. But the composition of Congress determines whether deficit reduction happens through spending cuts (Republican scenario), tax increases (Democratic scenario), or simply doesn’t happen at all — which is the most likely outcome under either scenario.
3. Healthcare: The Sleeper Issue
As a result of the decrease in ACA subsidies, an estimated 20 million Americans are seeing their insurance premiums roughly double starting in January 2026. This is the kind of kitchen-table issue that can shift suburban swing districts — the same districts that will decide control of the House.
Healthcare has typically been the best-performing sector in midterm election years. Given recent tailwinds, these stocks may still have room to run in 2026. Pharmaceutical and insurance companies face different regulatory risks depending on which party gains control — but the sector as a whole tends to benefit from election-year attention because uncertainty about reform gets priced in early and then resolves.
The View: Healthcare is the most asymmetric policy bet in 2026. A Democratic wave puts downside pressure on pharma margins and insurer profitability. A Republican hold likely extends the status quo, which benefits large managed care organizations. Watch the polling in 10 key swing districts — they’ll telegraph the sector’s direction before any analyst can.
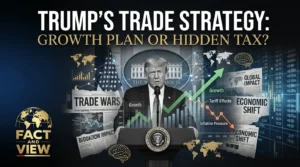
4. Tariffs, Trade, and the Supply Chain Question
The Supreme Court is expected to rule shortly on whether the administration had the legal authority to impose the majority of its tariffs, with consensus putting the odds of a ruling against the administration at around 75%, according to betting markets.
A Democratic takeover of either chamber would likely produce legislative pressure to curtail executive tariff authority. That’s not guaranteed to reduce tariffs — but it changes the balance of power over trade policy in ways that directly affect manufacturing costs, import pricing, and agricultural exports.
Fact: Stanford’s Institute for Economic Policy Research notes that the administration has already retreated from the most extreme “Liberation Day” tariffs and rolled back duties on salient foodstuffs following the party’s poor performance in November 2025 elections — suggesting tariff policy is responsive to political pressure.
Risks & Opportunities: Three Scenarios for November
Base Case (~50% probability): Split Congress
Democrats flip the House; Republicans hold the Senate. Historical norm reasserts itself. Gridlock on major legislation. Tax cut extensions stall. Debt ceiling drama creates short-term volatility in Q1 2027. Markets rally post-election on clarity.
Market implication: The “uncertainty discount” in equities disappears. Based on historical trends, the S&P 500 has historically achieved an average return of 16.3% in the 12 months after midterms. Divided government historically correlates with that outcome because it forces compromise and reduces the risk of dramatic policy reversals.
For your wallet: Tax policy stability for 2027. Healthcare subsidies may be partially restored. Tariff authority constrained legislatively. Mortgage rate relief depends on Fed, not Congress.
Upside Scenario (~25% probability): Republican Hold
Republicans maintain control of both chambers. Trump’s legislative agenda — tax cut extension, further deregulation, energy expansion — moves forward. Corporate tax environment remains favorable. Deficit concerns grow but are deferred.
Market implication: Pro-business sectors (energy, financials, industrials) outperform. Defense spending expands. Regulatory burden on banks and tech eases.
For your wallet: Tax cuts extended means smaller brackets for high earners. Healthcare subsidy rollbacks continue. Energy production increases, potentially softening fuel prices by 2027.
Downside Scenario (~25% probability): Democratic Wave
Democrats capture both chambers, driven by economic discontent and affordability anger. Aggressive push to raise corporate taxes, expand healthcare coverage, and rein in presidential trade authority.
Market implication: If Democrats win so decisively on economic and affordability issues that the White House considers standalone stimulus measures — like reducing some tariffs — it could provide a short-term consumer spending boost but raise fiscal concerns longer-term.
For your wallet: Possible restoration of ACA subsidies lowers insurance costs for 20 million Americans. Corporate tax hikes could pressure equity valuations. Tariff reductions could soften inflation.
The Midterm Volatility Pattern: Know What’s Coming
Since its creation in 1957, the S&P 500 has returned an average of 1% during midterm election years, and it has suffered an average intra-year drawdown of 18%. That isn’t a reason to panic — it’s a reason to prepare.
The most pronounced downside typically appears in late summer and early fall, with a steady decline leading to a significant trough around early to mid-October. From that October low, the composite projects a strong rebound, with the index rallying sharply through November and December.
The View: The midterm volatility script is well-worn enough that sophisticated investors use the pre-election dip as a buying opportunity. The question in 2026 is whether the oil shock and sticky inflation alter the timing. They might — but they don’t change the fundamental dynamic. Once the ballot results are in, uncertainty clears, and capital moves.
The Bottom Line
For consumers. The biggest near-term lever isn’t November — it’s the Fed. Rate cuts don’t come from Congress. If you’re waiting for mortgage relief, watch inflation data and the FOMC calendar more closely than any campaign ad. The midterms set the fiscal environment for 2027 and beyond, not the interest rate environment for Q3 2026.
For small business owners. Tax policy is the pivotal issue. The 2017 TCJA provisions expire in 2027. A Republican hold extends them; a Democratic wave likely modifies or partially reverses them. Model both scenarios for your 2027 tax liability now — don’t wait for the election results in November.
For investors. A hypothetical portfolio that stayed fully invested through both Democratic and Republican administrations has performed better over the long term than one invested only when one party was in power. The key takeaway: the more time investors spend in the market — regardless of the party in the White House — the better.
Don’t let a midterm election trigger a portfolio overhaul. Use the pre-election volatility — likely concentrated in August through October — as a dollar-cost-averaging opportunity rather than a reason to exit.
The November ballot sets the rules. The market sets the price. And historically, the price goes up once the rules are clear.
Frequently Asked Questions
Q: Do elections actually move the stock market?
Yes — but the mechanism is uncertainty, not ideology. Markets have historically performed poorly in the months leading up to midterms, with an average pre-election return of just 2.9% versus the long-run norm of 8.9%. But the post-midterm period tells a different story: the S&P 500 has historically averaged 12.4% returns in the 12 months after midterm elections. The driver is clarity, not which party wins.
Q: Which party is better for the stock market?
Neither has a consistent edge over long periods. Historically, markets have performed well under single-party rule and different combinations of divided government. A portfolio that stayed fully invested through both Democratic and Republican administrations has performed better over the long term than one invested only during one party’s tenure. Trying to time the market around party control is a losing strategy.
For the real data, see Invesco’s long-term election and market analysis and the U.S. Bank 125-year market study.
Q: What happens to the stock market if Republicans lose the House?
Based on history, a short-term bout of volatility followed by a post-election rally. Morgan Stanley’s economists think that growth outcomes are only going to vary modestly across scenarios, while the broader business cycle should stay intact. The sectors most directly affected would be healthcare (upside risk if ACA subsidies are restored), pharmaceuticals (downside risk from drug pricing pressure), and energy (downside risk if permitting reforms stall).
Q: How do midterms affect interest rates and mortgages?
They don’t — directly. The Federal Reserve sets interest rates independently of Congress, and the Fed’s decisions in 2026 are driven by inflation and employment data, not election outcomes. However, midterm results shape fiscal policy, which affects the deficit, Treasury supply, and ultimately long-term bond yields — which do influence mortgage rates. Monitor real-time rate expectations at the CME FedWatch Tool and inflation data at FRED.
Q: What issues are driving the 2026 midterm elections?
Affordability dominates. Overall grocery prices have risen 31% since February 2020, and the government’s inflation report for February 2026 showed grocery prices rising at an annualized pace of roughly 5%. The political power of affordability became undeniable when Democrats swept the New Jersey, Virginia, and New York City elections in November 2025. Gas prices, healthcare premiums, and housing costs round out the top concerns. Read the Brookings Institution’s full affordability analysis for deeper context.
Q: Should I change my investment portfolio before the election?
Almost certainly not. The data consistently shows that political timing of portfolios underperforms a stay-invested approach. The S&P 500 has returned an average of 1% during midterm election years but has historically rebounded sharply — stocks typically return an average of 14% in the six months following midterm elections.
If you have a long-term plan aligned to your goals and risk tolerance, the playbook is discipline: don’t sell into the pre-election dip. Use volatility in August–October as an opportunity to add to high-conviction positions at lower prices. See Capital Group’s midterm investor guide for historical charts.
Q: Where can I track the 2026 midterm elections and their economic implications?
Primary sources worth bookmarking:
- Brookings Institution — 2026 Midterm Series — nonpartisan political and economic analysis
- Stanford SIEPR — U.S. Economy 2026 — academic economic forecasting
- Morgan Stanley — 2026 Policy Pulse — sector-by-sector investment implications
- CME FedWatch Tool — live Fed rate cut probability
- FRED Economic Data — inflation, employment, and GDP data from the St. Louis Fed
- U.S. BLS — Consumer Price Index — official monthly inflation data
Sources: Brookings Institution · Morgan Stanley 2026 Policy Trends · Morgan Stanley Midterms Podcast · Capital Group Midterms Analysis · U.S. Bank 125-Year Market Study · Ameriprise Financial · Stanford SIEPR · CNBC All-America Economic Survey Q1 2026 · Invesco Midterm Analysis
© Fact and View, 2026. For informational purposes only. Not investment advice.

Be First to Comment