
The U.S. government spent $88 billion on debt interest in March 2026 alone. Not defense. Not Medicare. Not infrastructure. Interest. That is more than $22 billion every week — and more than the federal government spends on education and defense combined in the same period. While Washington debates tax cuts and entitlement reform, the interest meter runs 24 hours a day, seven days a week, compounding silently and reshaping every corner of the American economy.
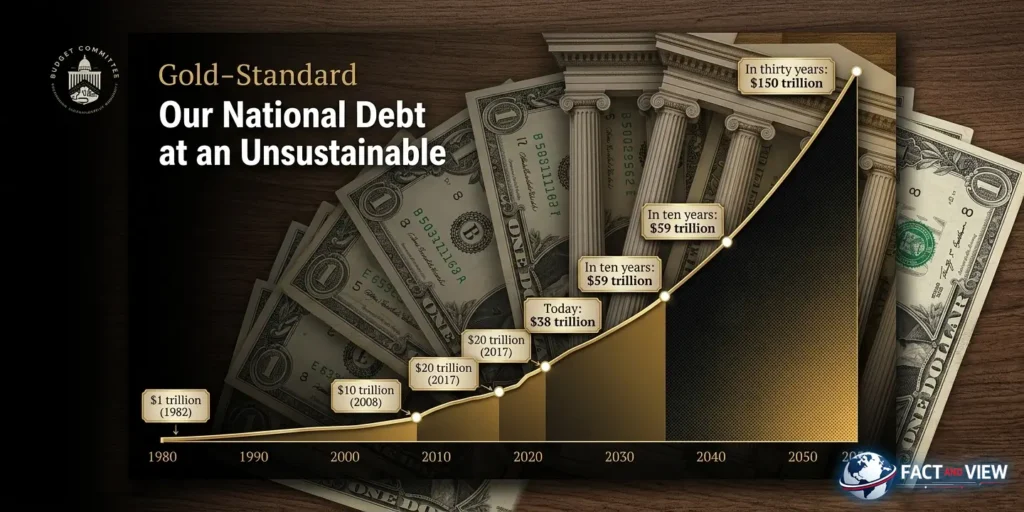
The national debt just crossed $39 trillion. Should you be worried? The honest answer is: yes — but not for the reason most people think. It’s not the headline number that should alarm you. It’s the velocity, the trajectory, and the structural trap that is already changing how much you pay to borrow, what the government can afford to fund, and how much fiscal firepower America has left when the next crisis arrives.
The Big Picture: How We Got to $39 Trillion
The national debt doesn’t grow by accident. It grows through a series of deliberate choices — tax cuts, spending expansions, emergency stimulus — each politically rational in isolation, collectively catastrophic in combination.
Fact: The federal budget deficit for fiscal year 2026 is projected at $1.9 trillion — 5.8% of GDP — per the Congressional Budget Office’s February 2026 Budget and Economic Outlook. This follows a $1.8 trillion deficit in both FY 2024 and FY 2025. Deficits are expected to average more than 6% of GDP over the next decade, eclipsing $2 trillion by FY 2028 and ultimately reaching $3.1 trillion annually by FY 2036.
Fact: The federal government borrowed $1.7 trillion in the 12 months between May 2025 and April 2026, per the Committee for a Responsible Federal Budget’s latest estimates. February 2026 alone saw $308 billion in new borrowing — a single-month record.
Fact: Total federal debt held by the public — the portion actually financed in markets — now equals approximately 100% of U.S. GDP in 2026. Under CBO’s long-term projections, it reaches 175% of GDP by 2056, per the Bipartisan Policy Center’s deficit tracker.
These numbers have a historical context that matters. The only time U.S. debt approached this scale relative to GDP was immediately after World War II — when it peaked at 106% of GDP. At that point, the U.S. was the world’s undisputed industrial power, global competition was minimal, and decades of post-war growth were waiting to absorb the debt. That condition does not exist in 2026. Growth is projected at 2.0%–2.3%, the demographic tailwind from the Baby Boom has reversed, and entitlement costs are accelerating regardless of what Congress does.
The View: The trajectory is what matters — not just the level. A debt at 100% of GDP that is growing toward 120% in five years and 175% in thirty is a fundamentally different risk profile than a debt that is stable or declining. No credible fiscal scenario — under any combination of party control — currently produces a stabilizing path. That is the core problem, and it’s why the national debt is not a political abstraction. It is an accelerating financial condition with real, measurable consequences for every household in America.
Understanding why this debt trajectory matters also requires understanding the institution that shapes borrowing costs, interest rates, and financial conditions across the economy — including what the Federal Reserve actually does and how its decisions influence the U.S. economy.
Deep Dive: Five Ways the National Debt Affects You Right Now
1. Interest Payments Are Consuming the Federal Budget
The single most concrete consequence of the national debt is the cost of servicing it — and that cost has reached levels that are restructuring the entire federal spending landscape.
Fact: Net interest payments on the national debt will total $1.0 trillion in FY 2026 — the first time in U.S. history that interest costs exceed $1 trillion in a single year, per Peter G. Peterson Foundation data. Interest costs already exceed spending on Medicare. They already exceed the entire national defense budget. Over the next decade, CBO projects cumulative interest payments of $16.2 trillion — $4.3 trillion more than total projected defense spending over the same period.
Fact: Interest payments as a share of federal revenue reached 18.5% by the end of FY 2025 — the highest since 1991. They are projected to reach 25.8% of revenue by 2036. Every dollar that goes to bond interest is a dollar unavailable for roads, schools, medical research, disaster relief, or military readiness.
The crowding-out arithmetic is straightforward: when interest is the fastest-growing line item in the federal budget, it consumes the fiscal space that would otherwise fund productive investment. That’s a structural drag on long-run economic growth — and ultimately on the living standards of every American who depends on a growing economy for wage gains and job opportunities.
2. Treasury Supply Is Keeping Your Mortgage Rate High
Here is the direct line from federal borrowing to your monthly mortgage payment. To finance its $1.9 trillion annual deficit, the Treasury issues bonds — lots of them. More supply requires higher yields to attract buyers. Higher 10-year Treasury yields directly push mortgage rates up, because 30-year mortgage rates are priced as a spread over the 10-year Treasury.
Fact: In late March 2026, a series of weak Treasury auctions sent a clear market signal. Primary dealers absorbed 24% of a two-year note auction — approximately twice their normal share — with five- and seven-year securities also seeing poor demand, per the Bipartisan Policy Center’s fiscal tracker. When the buyers of last resort absorb double their normal allocation, it means the rest of the market didn’t show up. That is a structural warning about sustained demand for American debt.
Fact: The 30-year fixed mortgage rate currently averages 6.47%–6.54% nationally, per Bankrate’s May 7, 2026 survey. Charles Schwab’s 2026 fixed income outlook projects 10-year Treasury yields not falling below 3.75% even in a rate-cutting cycle — meaning mortgage rates are structurally unlikely to return to 5.5% or below without a significant fiscal adjustment that reduces Treasury supply.
The View: The mortgage rate pain that 130 million American homeowners and aspiring buyers feel daily has a fiscal origin that rarely gets named. The Fed’s rate decisions get all the headlines, but the Treasury’s borrowing volume is a structural floor under long-term rates that no Fed action can fully overcome. As long as the federal government borrows $1.9 trillion annually, long-term rates stay elevated — regardless of what the FOMC decides in any given meeting.
3. The Debt Spiral Risk Is No Longer Theoretical
The most dangerous scenario in fiscal analysis is called a debt spiral: when interest costs push up yields, which increases borrowing costs, which expands the deficit, which requires more borrowing, which pushes yields higher still. This feedback loop, once established, is extraordinarily difficult to escape without either explicit default, inflation monetization, or severe austerity.
Fact: A Committee for a Responsible Federal Budget analysis of CBO’s February 2026 baseline shows that the average interest rate paid on the national debt could exceed the economic growth rate starting in FY 2031. When the interest rate on debt exceeds the growth rate of the economy — a condition economists call the “r > g” scenario — the debt-to-GDP ratio rises automatically without any new spending decisions, absent primary surpluses. The U.S. has not run a primary surplus (revenues exceeding non-interest expenditures) since FY 2001.
The View: The debt spiral threshold in 2031 is five years away. That sounds distant until you consider that it takes at least 5–10 years to pass, implement, and observe the economic effects of major fiscal reforms. The window for acting before the spiral threshold is not 2031 — it’s now. Every year of delay narrows the set of available solutions and increases the economic cost of the eventual adjustment.
4. Reduced Fiscal Space for the Next Recession
Every recession in modern U.S. history has been fought with fiscal stimulus. The 2009 recovery package: $831 billion. The COVID-19 response: approximately $5 trillion across multiple bills. These responses were only possible because the U.S. retained the fiscal capacity to borrow at scale on short notice at manageable rates.
Fact: With debt already at 100% of GDP and annual deficits running at $1.9 trillion in a non-recessionary year, the fiscal cushion for the next downturn has shrunk dramatically. Replicating COVID-level stimulus in 2026 would add $5 trillion to a debt already at $39 trillion, in an environment where Treasury auctions are already showing demand weakness — a combination that risks a genuine loss of market confidence in U.S. creditworthiness.
The IMF’s April 2026 World Economic Outlook explicitly flagged elevated U.S. debt as a risk factor that constrains fiscal policy response capacity. When the next recession arrives — and recessions are not optional, only unpredictable in timing — the U.S. will face a stark tradeoff between fiscal stimulus and fiscal credibility that it did not face in 2009 or 2020.
5. Inflation Risk From the Fiscal-Monetary Nexus
The relationship between deficit spending and inflation is not mechanical — but it is real under specific conditions. When the government issues large volumes of debt and the central bank is under political pressure to keep rates low, the risk of fiscal dominance emerges: a scenario where monetary policy is effectively subordinated to the government’s financing needs.
Fact: President Trump publicly pressured the Federal Reserve to cut rates in early 2026, explicitly referencing the need to reduce the government’s borrowing costs on the national debt. The Fed held firm in April — but Fed Chair Jerome Powell’s term ended in May 2026, and incoming chair Kevin Warsh faces the same political pressure without the institutional credibility buffer Powell had accumulated.
The View: Fiscal dominance is not a theoretical risk. It has precedent. The 1940s and early 1950s saw the Fed formally subordinated to Treasury interests — holding rates artificially low to manage war debt, producing sustained inflation as a result. The resolution — the 1951 Treasury-Fed Accord — required a formal agreement to restore central bank independence. The conditions for a similar confrontation are present in 2026: record debt, political rate-cut pressure, and a leadership transition at the Fed. The probability is low. The consequence, if it materializes, is severe.
Risks & Opportunities: Three Scenarios
Base Case (~50% probability): Slow Deterioration, No Crisis
Deficits run at $1.9–$2.1 trillion annually through 2028. Debt reaches 108% of GDP by 2030. Interest payments consume a growing share of the budget, gradually crowding out discretionary spending. No acute market crisis. Mortgage rates remain structurally elevated. Growth continues at 1.8%–2.3%.
What this means for you: No dramatic crisis — just a steady erosion of what government can provide and a structural floor under your borrowing costs. Federal programs face quiet compression. Effective tax rates likely rise for future generations to service current borrowing.
Upside Scenario (~20% probability): Bipartisan Fiscal Reform
Bond market pressure — sustained weak Treasury auctions and rising yields — forces a bipartisan fiscal deal combining entitlement reforms with revenue increases. The primary deficit stabilizes by 2029. Debt trajectory bends, long-term Treasury yields fall, mortgage rates ease toward 5.5%–6%.
What this means for you: This is the most economically constructive outcome for every American borrower. It requires political will that is currently absent — but bond market discipline has forced fiscal adjustments in other countries (Canada in the 1990s, Sweden in the early 1990s) and can do so here.
Downside Scenario (~30% probability): Market Discipline Event
Sustained weak Treasury demand forces yields above 5% on the 10-year. Mortgage rates return to 7.5%–8%. The dollar weakens, imported inflation rises. The Fed faces a choice between defending price stability and defending financial system stability. A debt crisis doesn’t mean explicit default — it means a disorderly repricing of U.S. risk that disrupts every financial market simultaneously.
What this means for you: Mortgage rates at 1980s levels. Business borrowing contracts sharply. Federal spending cuts arrive suddenly rather than gradually. Recession deepens without the fiscal tools to fight it. This scenario’s 30% probability is higher than most investors currently price — which is itself a risk.
The Bottom Line
Should you be worried? Yes — calibrated, action-oriented concern is the correct response. Not panic. Not dismissal. The national debt is not a future risk that eventually becomes a current problem. The $88 billion in monthly interest payments, the elevated mortgage rates, the weakening Treasury auctions, and the shrinking fiscal buffer are all present-tense consequences.
For consumers: The debt’s most direct near-term impact is on your borrowing costs. Structural upward pressure on Treasury yields means mortgage rate relief will arrive more slowly and be smaller in magnitude than the interest rate cycle alone would suggest. If you’re carrying high-interest debt, eliminate it before counting on rate cuts to arrive on your preferred schedule.
For investors: Treasury Inflation-Protected Securities (TIPS) and short-duration government bonds offer real yields of 1.25%–2.0% — structurally attractive in an environment where the fiscal trajectory increases long-run inflation risk. Gold’s role as a reserve asset alternative is validated by the same central bank buying behavior that reflects concern about dollar-denominated sovereign debt sustainability.
For business owners: Model your 2027 and 2028 tax scenarios across the full range of possible outcomes — rate increases remain a fiscal arithmetic inevitability under any scenario that takes the debt seriously. Businesses that plan for a higher-tax, higher-rate environment and are surprised by continuity are better positioned than those planning for continuity and surprised by adjustment.
The national debt is the defining fiscal fact of the American economy in 2026. Every rate decision, every budget negotiation, and every investment thesis operates in its shadow. Ignoring it is not a strategy. Understanding it is.
FAQ
What is the U.S. national debt right now in 2026?
Total U.S. national debt — including debt held by the public and intragovernmental holdings — has crossed $39 trillion as of mid-2026. The more economically relevant figure is debt held by the public, which equals approximately 100% of U.S. GDP. This is the portion financed in bond markets and subject to interest rate risk. You can track the real-time debt figure at the U.S. National Debt Clock and official government borrowing data at TreasuryDirect.gov.
How much does the U.S. pay in interest on the national debt?
The federal government paid approximately $529 billion in net interest in just the first six months of FY 2026 (October 2025 through March 2026) — equating to more than $88 billion per month and over $22 billion per week. For the full fiscal year 2026, net interest payments are projected to exceed $1 trillion — the first time in U.S. history. CBO projects those payments to more than double to $2.1 trillion annually by 2036. Track monthly updates at the Peter G. Peterson Foundation’s Interest Tracker.
Why does the national debt keep growing if the economy is doing okay?
The deficit is structural, not cyclical. Even in years of solid growth, the U.S. spends significantly more than it collects in revenue — driven by Social Security, Medicare, Medicaid, and now interest payments themselves. CBO projects deficits will total $24.4 trillion over FY 2027 to FY 2036 — averaging 6.1% of GDP — eclipsing $2 trillion by FY 2028 and reaching $3.1 trillion annually by FY 2036. No amount of growth at plausible rates eliminates a structural primary deficit of this scale without explicit policy change on revenues or spending.
Does the national debt directly cause higher mortgage rates?
Not exclusively — but it is a major structural contributor. The government finances its deficit by issuing Treasury bonds. More issuance requires higher yields to attract buyers. In late March 2026, weak Treasury auctions saw primary dealers absorb 24% of a 2-year note auction — roughly twice their normal share — with 5- and 7-year securities also experiencing soft demand. Since 30-year mortgage rates are priced as a spread over the 10-year Treasury yield, elevated Treasury supply keeps mortgage rates higher than Fed policy alone would produce.
What is a debt spiral and could the U.S. fall into one?
A debt spiral occurs when the interest rate on government debt exceeds the economy’s growth rate — meaning debt grows faster than the economy’s ability to service it, requiring ever-more borrowing to cover the shortfall. A CRFB analysis of CBO’s February 2026 baseline shows the average interest rate paid on the national debt could exceed the economic growth rate starting in FY 2031. This is not inevitable — but it becomes more likely with each year that fiscal reform is delayed.
Will taxes have to go up because of the national debt?
Mathematically, yes — under virtually every scenario that stabilizes the debt trajectory. The question is when and on whom. Current projections don’t require immediate tax increases, but the longer the structural deficit persists, the more expensive the eventual adjustment becomes. CBO’s long-term projections show total deficits averaging 7.2% of GDP over the next three decades, with debt rising from 100% of GDP in 2026 to 175% of GDP by 2056. Business owners and high-income households should model 2027–2028 scenarios that include corporate and income tax increases as a planning contingency.
Where can I track U.S. national debt and fiscal data?
The most reliable primary sources:
FRED — Federal Debt as % of GDP — historical context from the St. Louis Fed
CBO Budget and Economic Outlook 2026 — the definitive 10-year fiscal projection
Committee for a Responsible Federal Budget — real-time deficit and debt analysis
Bipartisan Policy Center Deficit Tracker — monthly fiscal updates
PGPF Interest Cost Tracker — monthly interest payment data
Treasury Fiscal Data — Debt to the Penny — daily official national debt figure
Sources: CBO Budget and Economic Outlook, February 2026 · CRFB — $1 Trillion Deficit, First Five Months FY 2026 · CRFB — $1.7 Trillion Borrowed, May 2025–April 2026 · Fortune — $88 Billion/Month in Interest, April 2026 · Fortune — $276 Billion Interest, Q1 FY2026 · PGPF Interest Cost Tracker · Bipartisan Policy Center Deficit Tracker · American Action Forum — CBO February 2026 Analysis · Bankrate Mortgage Rates, May 7, 2026 · IMF World Economic Outlook, April 2026
© Fact and View, 2026. For informational purposes only. Not investment advice.


Be First to Comment