By almost every long-term metric, the U.S. stock market is historically expensive. The Buffett Indicator — the total market cap-to-GDP ratio that Warren Buffett once called “probably the best single measure of where valuations stand” — hit 232.6% in early 2026, the highest reading ever recorded. The CAPE ratio (Shiller P/E) sits at roughly 37, nearly double its long-run historical average of 17.7. And yet the market hasn’t collapsed. Earnings are growing. AI investment is booming. So what does it actually mean when a market is “overvalued” — and what should you do about it?
This is not a simple yes or no question. The answer depends on which metrics you trust, what time horizon you’re investing over, and whether the structural case for elevated valuations in 2026 has real merit or is just a rationalization for a bubble.
Let’s break it down.
The Big Picture: A Market Trading at Peak Valuations
The S&P 500 is trading at valuations that, by most historical benchmarks, sit in the top 1–3% of all readings since 1881. That’s not a headline designed to cause panic. It’s the data.
Fact: The S&P 500’s trailing P/E ratio stands at approximately 26–27 as of May 2026, above the historical median of around 18. The typical value range for the past five years has been 19.83 to 26.34 — the current reading of 27.49 is above even that elevated recent band, according to data as of May 1, 2026.
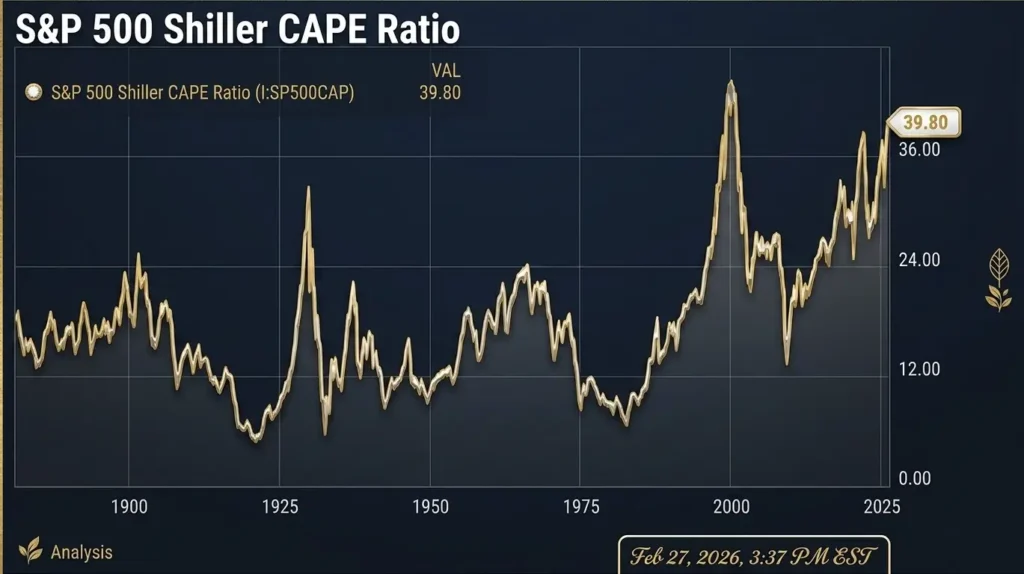
Fact: The Shiller P/E (CAPE ratio) — which smooths earnings over a 10-year inflation-adjusted window to eliminate business cycle distortions — stood at 37.1 as of March 2026, according to Advisor Perspectives. The historic average is 17.7. The current ratio is 66% above its long-term trendline and sits at approximately the 97th percentile of its historical range going back to 1881.
Fact: The Buffett Indicator — total U.S. market cap divided by GDP — reached 232.6% in early 2026, the highest level ever recorded. It sits 67.7% above its trendline (2.05 standard deviations above), according to Advisor Perspectives’ March 2026 update. For context: before the dot-com crash, it hit 146%. Before the 2008 financial crisis, it reached 109%. Today it is nearly 60% higher than either of those historic peaks.
Fact: A composite of four major valuation models tracked by Advisor Perspectives shows the market is overvalued in the range of 108% to 184% above historical mean values as of March 2026 — one of the highest readings in history. For eleven consecutive months, the composite has been more than three standard deviations above its historical mean.
The View: These are not marginal overvaluations. They are extreme readings by any historical frame of reference. The market has been expensive since 2019 and has kept climbing. That’s precisely what makes this moment dangerous and interesting in equal measure — overvaluation is not a timing signal, but it is a risk signal, and the risk has compounded significantly.
Deep Dive: Four Reasons the Market Is Where It Is
1. The AI Premium: Real, but Priced for Perfection
The dominant narrative justifying current valuations is artificial intelligence. Microsoft, Nvidia, Alphabet, Meta, and Amazon — the five companies that account for a disproportionate share of S&P 500 market cap — have posted genuine earnings growth driven by AI infrastructure spending and software monetization.
UBS Global Wealth Management’s Head of Equities Americas David Lefkowitz stated that growth in AI investment and adoption is likely to continue at a robust pace into 2026, with all signs pointing to continued earnings growth as the market driver.
Fact: S&P 500 consensus earnings estimates for 2026 project “as reported” earnings reaching approximately $310 by year-end, up from $277.70 at the end of Q1 2026 and $242.25 for the full year 2025, per Advisor Perspectives’ analysis of Standard & Poor’s data.
The View: The AI earnings narrative is real. It is not, however, a blank check for any valuation. Markets that are priced for perfection — meaning that continued above-trend earnings growth is not just expected but required to justify current prices — face asymmetric downside risk. If AI monetization disappoints, slows, or faces regulatory headwinds, there is no valuation floor nearby to catch the fall. The CAPE ratio, by design, is slow to incorporate sudden earnings improvements, which is a legitimate structural caveat. But even adjusting generously for AI-driven earnings acceleration, the current CAPE of 37 implies forward returns well below historical norms.
2. The Interest Rate Trap
Markets don’t exist in a vacuum. They are valued relative to alternatives — and for decades, the key alternative was the 10-year Treasury yield. When yields were near zero in 2021, a P/E of 35+ was defensible because bonds offered almost nothing. In 2026, that calculus has changed.
Fact: The 10-year Treasury yield currently sits in the range of 4.32–4.45%, testing nine-month highs in late April 2026, driven by Middle East energy shock concerns and persistent above-target inflation (Core PCE at 3.0% in February 2026). At 4.3–4.5%, the 10-year Treasury offers investors a meaningful real return — and directly competes with equity valuations.
Fact: The earnings yield of the S&P 500 (the inverse of the P/E ratio) at a P/E of 27 is approximately 3.7%. That is lower than the yield on a risk-free 10-year Treasury. In finance, this is called a negative equity risk premium — investors are effectively accepting less return from stocks than from bonds, adjusted for risk. That has historically been a precursor to underperformance.
The View: The interest rate environment in 2026 is structurally hostile to extreme equity valuations in a way that 2020–2021 was not. High bond yields mean the opportunity cost of owning expensive stocks is real and measurable. If Charles Schwab’s 2026 outlook is correct — that 10-year Treasury yields won’t fall much below 3.75% even with Fed cuts — the negative equity risk premium is not going away. This is a structural headwind that most retail investors are not pricing into their holding decisions.
3. Concentration Risk: Five Stocks Are Not the Market
The S&P 500 in 2026 is not a diversified cross-section of the U.S. economy. A handful of mega-cap tech companies — the so-called Magnificent Five-plus — account for a share of index market cap that has no historical precedent outside the peak of the dot-com bubble.
When the “market” goes up, it frequently means those five companies are going up. When they fall — due to regulatory pressure, earnings misses, or a shift in AI sentiment — the index falls with them, even if the other 495 companies are performing normally.
The View: Owning a passive S&P 500 index fund in 2026 is not the same diversification exercise it was in 2000, 2010, or even 2020. Concentration at the top of the index means that a valuation correction in a handful of stocks can produce index-level drawdowns that feel like a broad market collapse but are actually a sector-specific event. Investors who believe they are diversified may not be.
4. The Geopolitical and Fiscal Overlay
Layer in the macro context: the Middle East energy shock has pushed oil above $100, raised inflation expectations, and sent Treasury yields to nine-month highs. A $1.9 trillion federal deficit is adding record supply of Treasuries to the market. Weak Treasury auctions in March 2026 showed that demand is not keeping pace with supply — which structurally pushes yields higher and valuation multiples lower.
Fact: As of May 4, 2026, the Buffett Indicator at the current TMC/GNP ratio implies a projected stock market return of approximately -0.7% per year over the next eight years, based on GuruFocus’s historical model. This is not a prediction. It is a long-run statistical relationship between current valuations and subsequent 8-year returns.
Risks & Opportunities: Three Scenarios
Base Case (~45% probability): Slow Melt, Not a Crash
The market drifts sideways or slightly lower through 2026 as earnings growth partially compensates for valuation compression. The S&P 500 returns 3–6% for the year — below its long-run average — with high volatility tied to inflation data, Fed decisions, and geopolitical events.
What this means for you: Buy-and-hold investors who stay the course do fine over a decade but should not expect strong returns over 3–5 years. Annual rebalancing toward value, international equities, and TIPS becomes more important than in a bull-market environment.
Upside Scenario (~25% probability): AI Earnings Explosion Justifies the Multiple
Generative AI monetization accelerates faster than consensus expects. Corporate earnings growth of 15%+ per year compresses valuation multiples organically, without requiring price declines. The market rises another 10–15% even from elevated valuations, as new earnings make today’s P/E look retrospectively reasonable.
What this means for you: The AI mega-caps continue to outperform. Passive index investors benefit. Investors who sold out of equities to “wait for a correction” miss the rally. This is the scenario most current holders are implicitly betting on.
Downside Scenario (~30% probability): Multiple Compression Event
A combination of factors — sustained high Treasury yields, earnings disappointment in AI names, or a geopolitical shock — triggers a derating of market multiples. The P/E contracts from 27 toward its historical median of 18. With no earnings collapse, this implies roughly a 30–35% market decline from current levels.
Fact: The P/E10 (CAPE) is currently at approximately the 97th percentile of all historical readings. Advisor Perspectives notes that historically, when the P/E10 has fallen from the top quintile, it has often continued its decline into the lowest quintile. Reaching a single-digit P/E10 today would require the S&P 500 to fall below 1,782 — unless corporate earnings see a sustained and significant increase.
What this means for you: A 30% correction would erase approximately $12–14 trillion in household wealth. Retirement accounts, home equity, and consumer confidence would all take significant hits. The Fed would likely respond with emergency rate cuts — but with inflation still above target, its ability to respond aggressively would be constrained in the early stages of a sell-off.
The Bottom Line
So: is the market overvalued? Yes, by every long-run metric that has predicted returns with any reliability over the past century. That doesn’t mean a crash is imminent. Overvalued markets can stay overvalued for years. But it does mean three things that matter directly for your portfolio:
First, future expected returns are lower. This is mathematical, not speculative. When you pay a premium price for any asset, you lock in lower future returns. At a CAPE of 37, the historical model implies below-average long-run equity returns — likely in the 4–6% nominal range rather than the 9–10% investors have grown accustomed to from 1980–2020.
Second, your downside risk is asymmetric. At normal valuations, a bear market might mean a 20–25% decline before fair value is reached. At current valuations, reaching historical median valuations could require a 35–40% decline. The cushion is gone.
Third, asset allocation matters more than ever. With Treasury yields at 4.3–4.5% and TIPS offering real yields of 1.25–2.0%, bonds are finally competitive with stocks in a way they haven’t been in 15 years. A portfolio that ignores fixed income in favor of 100% equities is taking concentration risk that the data does not currently justify.
The market being expensive doesn’t mean you should sell everything. It means you should be deliberate: rebalance toward value and international equities, hold meaningful bond exposure, understand that the Magnificent Five concentration in your index fund is a feature and a risk simultaneously, and don’t confuse a rising market with a safe market.
Overvaluation is not a timing tool. It is a risk register. Right now, that register is flashing at historic levels.
FAQ
1: What is the CAPE ratio and why does it matter?
The CAPE ratio — Cyclically Adjusted Price-to-Earnings, also called the Shiller P/E — divides the S&P 500 price by the average of 10 years of inflation-adjusted earnings. Unlike the standard P/E ratio, which is highly sensitive to short-term earnings swings (crashing during recessions and spiking during recoveries), the CAPE smooths out the business cycle to give a cleaner long-term valuation picture. The current CAPE of approximately 37 is nearly double its historical average of 17.7 and sits at the 97th percentile of all readings since 1881, per Advisor Perspectives’ March 2026 analysis. Research consistently shows that high CAPE readings correlate with below-average returns over the subsequent 10 years.
2: What is the Buffett Indicator and what is it saying in 2026?
The Buffett Indicator is the ratio of total U.S. stock market capitalization to GDP — a measure Warren Buffett once described as “probably the best single measure of where valuations stand at any given moment.” As of May 2026, it reads approximately 226–232%, the highest level ever recorded — well above the 146% it hit at the peak of the dot-com bubble in 2000, and more than double Buffett’s own 120% “overvalued” threshold. The de-trended reading sits 2.05 standard deviations above its trendline, according to Advisor Perspectives’ March 2026 update. At this level, GuruFocus’s historical model projects approximately -0.7% average annual returns over the next eight years.
3: Does an overvalued market mean a crash is coming?
Not necessarily, and not soon. Overvaluation is a long-run signal, not a short-run timing tool. Markets can remain expensive for years — as they did from 1996 through 2000, and from 2019 through 2022. The Buffett Indicator and CAPE ratio are not useful for predicting when a correction will happen; they are useful for setting expectations about the magnitude of future returns and the depth of any eventual correction. What the current data does tell you: at the 97th percentile of historical CAPE valuations, subsequent 10-year returns have historically been well below average. Plan your portfolio around probable, not hoped-for, return scenarios.
4: Is AI justifying the market’s high valuations?
Partially — and the nuance matters. AI is driving genuine earnings growth at the largest U.S. technology companies. Consensus S&P 500 earnings estimates for 2026 have been revised upward, with projected earnings reaching approximately $310 per share by year-end. That’s real. The problem is whether the current price already reflects — and then some — the best-case outcome for AI monetization. At a CAPE of 37, the market is not priced for average AI adoption. It is priced for exceptional, sustained AI-driven productivity acceleration. If that scenario delivers, current valuations may prove reasonable. If it disappoints, there is no safety net in the valuation multiples. David Rosenberg of Rosenberg Research notes the market is “way overpriced and too much AI-driven growth is being discounted.”
5: What should I actually do with my portfolio?
Three evidence-based adjustments, regardless of market timing:
- Rebalance toward bonds. With 10-year Treasury yields at 4.3–4.5% and TIPS offering real yields of 1.25–2.0%, fixed income is genuinely competitive with equities for the first time since 2007. A traditional 60/40 portfolio makes more sense in 2026 than at any point in the past 15 years. Track current rates at FRED or the U.S. Treasury’s daily yield page.
- Diversify internationally. U.S. stocks trade at a significant valuation premium to European, Japanese, and emerging market equities. A portion of equity exposure allocated internationally reduces concentration risk in U.S. mega-cap tech names and accesses markets trading at more reasonable historical multiples.
- Stay invested, but set realistic expectations. Don’t sell out of equities on the basis of valuation alone. Timing the market around valuation signals has historically cost investors more than overvaluation itself. But reset your return expectations: 4–6% nominal annual returns over the next decade are more realistic than the 10%+ of the prior bull market.
6: Where can I track U.S. stock market valuations myself?
These are the most reliable, free, primary sources:
- Advisor Perspectives Market Valuation Overview — monthly update of four major valuation models
- GuruFocus Buffett Indicator — daily updated TMC/GDP ratio with 8-year return projections
- Current Market Valuation — aggregates Buffett Indicator, CAPE, Price/Sales, and interest rate models
- Multpl.com — Shiller PE — live CAPE ratio updated monthly
- JP Morgan Guide to the Markets — forward P/E with 25-year historical context
- FRED — S&P 500 Price-Earnings Ratio — Federal Reserve’s economic data platform
Sources: Advisor Perspectives Market Valuation, April 2026 · Advisor Perspectives Buffett Indicator, March 2026 · Advisor Perspectives P/E10, March 2026 · GuruFocus S&P 500 PE Ratio · GuruFocus Buffett Indicator · Current Market Valuation · Charles Schwab Fixed Income Outlook 2026 · Newsweek — Buffett Indicator Warning · WorldPERatio.com — S&P 500 P/E, May 1 2026
© Fact and View, 2026. For informational purposes only. Not investment advice.


Be First to Comment