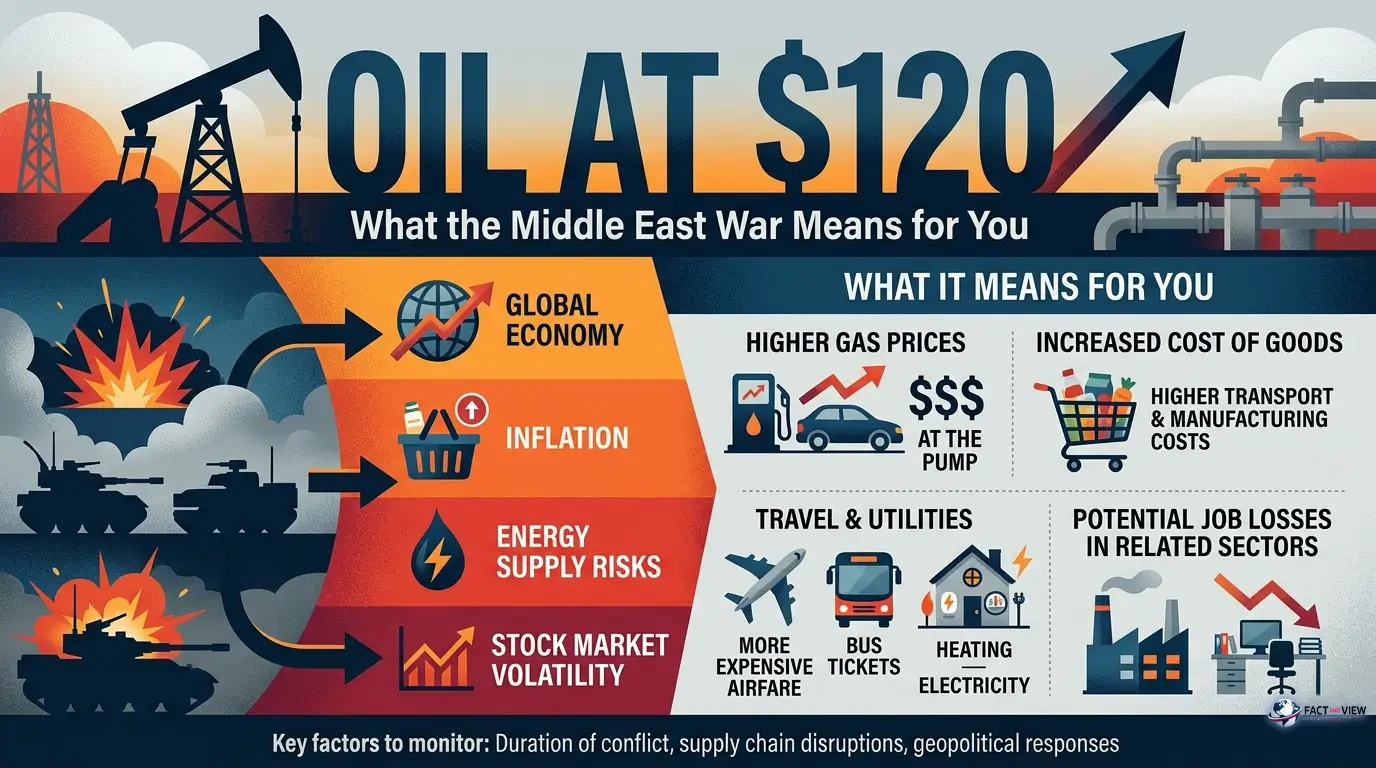
In February 2026, Goldman Sachs strategists projected Brent crude at $63–65 a barrel by year-end. Two months later, oil is trading above $100 — with some sessions touching $117. This isn’t routine futures volatility. It’s the largest oil supply shock since Russia’s invasion of Ukraine, and it is already reshaping your heating bill, your grocery tab, your mortgage timeline, and the Federal Reserve’s next move.
The Big Picture: Why Now?
In early March 2026, U.S. and Israeli military operations against Iran triggered the scenario energy markets had long feared but rarely priced as a base case. Within days, Iran partially blocked the Strait of Hormuz — a 54-kilometer chokepoint through which approximately 35% of global seaborne crude oil passes every day.

Fact: The disruption caused an initial reduction in global oil supply of roughly 10 million barrels per day — the largest supply shock on record, according to the World Bank’s April 2026 Commodity Markets Outlook.
Fact: Brent jumped roughly 15% in the opening days of the conflict, then surged above $120 a barrel. The World Bank now projects an average of $86 a barrel for 2026 — even assuming the most acute disruptions end by May.
But the headline number understates the structural damage. The Strait of Hormuz is not just an oil corridor. It carries LNG tankers from Qatar — the world’s third-largest gas producer — and handles a web of commodity flows that most people never think about. The conflict has already taken roughly one-third of global helium supply off the market following disruptions at Qatar’s Ras Laffan energy hub. That means delays for semiconductor fabs, medical imaging equipment, and aerospace components.
Deep Dive: Five Chain Reactions
1. Direct Price Pass-Through
Oil is the first derivative of almost everything. A move from $69 a barrel (the 2025 Brent average) to a projected $86–$115+ flows directly into:
- Airline tickets (fuel accounts for 25–30% of airline operating costs)
- Freight and last-mile delivery (diesel is the baseline variable cost)
- Plastics, fertilizers, and chemicals
- Food prices (the agricultural supply chain runs on diesel and fertilizer)
At the pump, Americans are already feeling it. According to AAA, the national average for regular gasoline hit $4.16 a gallon on April 9 — the highest since August 2022. That’s up from $2.98 on February 28, the day before the conflict began: a $1.18 jump in six weeks.
Fact: Fertilizer prices are already climbing in tandem with oil, threatening crop input costs for the 2026–2027 growing season across major agricultural exporters.
2. Shipping Insurance and Freight Rates
Several shipping firms have suspended tanker traffic through the strait entirely. Those still operating are paying war-risk premiums — specialty insurance surcharges for active conflict zones — that have surged to record levels. Every barrel rerouted around the cape adds cost and transit time.
The View: Elevated freight insurance is a hidden inflation tax with a long tail. Even if crude stabilizes at $86–$90, heightened maritime risk premiums will persist for 12 to 18 months after the strait normalizes. Companies are already baking those costs into 2027 pricing schedules. Consumers will feel it long after the conflict fades from front pages.
3. The Fed’s Monetary Trap
This is where the macro picture gets genuinely uncomfortable. Per the FOMC minutes from March 18, 2026, the federal funds rate sits at 3.5–3.75%. Futures markets have fully repriced away any rate cut in 2026. The near-term path has shifted to no change this year, compared to one 25-basis-point cut expected before the conflict began.
Fact: San Francisco Fed President Mary Daly told Reuters the oil shock “extends the timeline” for getting inflation back to the Fed’s 2% target and may leave the central bank in “a holding pattern” on rates.
Fact: Core PCE inflation stood at 3.0% in February 2026 — already above target before the energy shock compounded the picture.
The View: The Fed is caught in a textbook stagflationary trap. Higher oil accelerates inflation, which argues for holding or raising rates. But the economic drag from an energy shock argues for cutting them. The dominant risk isn’t recession per se — it’s policy paralysis. A Fed that stays frozen too long risks letting a supply-side shock harden into embedded inflation expectations.
Morgan Stanley maintains a base case of two 25-basis-point cuts in the second half of 2026, contingent on long-run inflation expectations remaining anchored. So far they have. But every week of prolonged conflict raises the probability that they don’t.
4. Asymmetric Pain Across Sectors and Regions
The shock is not distributed evenly. As a net oil exporter, the U.S. has a natural cushion: higher prices hurt consumers but benefit domestic shale producers in the Permian Basin and Bakken formation. That internal offset gives the Fed more patience than, say, the European Central Bank.
The damage is sharper elsewhere:
- Asia — Japan, South Korea, and India import over 80% of their oil consumption from the region or via the Strait
- India — higher energy costs are feeding inflation, weakening the rupee, and dragging growth
- China — elevated energy expenses are squeezing margins in steel, chemicals, and electronics, worsening an already strained trade position under U.S. tariff pressure
Fact: The IMF warned in March 2026 that inflation in developing economies could reach 5.8% in a severe scenario — a level exceeded only in 2022 over the past decade.
5. Supply Chains: The Second Wave
The first wave is expensive oil. The second wave is broader logistical disruption. Flights through Dubai have been partially grounded, interrupting gold transit to India and high-tech component flows across the Gulf. Qatar Airways has curtailed schedules. Insurers have suspended coverage in the conflict zone.
These secondary effects reach sectors with no direct oil exposure. Chip manufacturers in Taiwan and South Korea, steel mills in Brazil, pharmaceutical logistics through Singapore and Ireland — all face elevated costs and extended lead times from a conflict thousands of miles away.
Risks & Opportunities: Three Scenarios
Base Case (~50% probability)
The most acute Hormuz disruptions last through May–June. The strait gradually resumes normal traffic by late Q3. Brent stabilizes in the $85–$95 range. The Fed holds rates through December, then delivers one 25-basis-point cut. Global GDP for 2026 comes in below January forecasts, but recession is avoided.
What this means for you: Higher fuel and energy bills for six to twelve months. Inflation stays above 3% through year-end. Mortgage rates don’t move lower before Q1 2027.
Upside Scenario (~25% probability)
Diplomatic de-escalation accelerates — potentially brokered by Turkey or Qatar. The strait fully reopens by July. Brent retreats to $70–$80. The Fed has room for two cuts in 2026. Markets rally on geopolitical risk relief.
What this means for you: Airlines, transport stocks, and consumer discretionary equities recover. Mortgage relief arrives earlier than expected. Manufacturers see input cost pressure ease heading into 2027.
Downside Scenario (~25% probability)
The conflict escalates. Attacks damage oil infrastructure in Saudi Arabia or the UAE. Brent averages $115–$150. Global recession becomes the base case. The Fed faces pressure to raise rates if long-run inflation expectations break higher.
Fact: The World Bank acknowledges this scenario explicitly — if critical oil and gas facilities sustain more damage and export volumes are slow to recover, Brent could average as high as $115 a barrel for the full year, with inflation in developing economies rising to 5.8%.
The View: In this scenario, the damage is systemic, not cyclical. It forces a redesign of global supply chain architecture, a major realignment of geopolitical alliances, and a second wave of deglobalization after COVID-19. Businesses that spent 2020–2024 rebuilding supply chain resilience would face a second stress test before the first one is fully paid for.
The Bottom Line
For consumers. Lock in prices where you can. If your gas or electricity plan allows it, consider a fixed-rate contract for 12 to 24 months. Budget for fuel, groceries, and air travel remaining elevated through at least year-end 2026. Rate relief on mortgages and auto loans is delayed — plan accordingly.
For businesses. Companies with unhedged logistics exposure — food and beverage, retail, e-commerce — face margin compression in Q2 and Q3. Review supplier contracts with oil-linked pricing provisions. Fuel surcharge clauses in freight agreements are no longer optional risk management. They are baseline operating practice.
For investors. The geopolitical risk premium in oil is short-term; the structural earnings uplift for upstream producers is more durable. Integrated oil majors — ExxonMobil, Shell, TotalEnergies — are capturing a significant cash flow tailwind. Airlines and consumer discretionary names face headwinds. Gold and broad commodity exposure continue to serve their safe-haven function, with precious metals prices forecast to rise 42% in 2026 on geopolitical uncertainty, per the World Bank.
The core conclusion. The 2026 oil shock is not an isolated event. It is a new layer of geopolitical instability stacked on top of unresolved trade tensions, sticky inflation, and mounting debt burdens across the developing world. The global economy was not in peak condition to absorb a shock of this magnitude.
As World Bank Chief Economist Indermit Gill framed it, the war is hitting the global economy in cumulative waves — first through energy, then food, then inflation that makes debt more expensive for everyone.
The question is not whether you will feel this shock. The question is how long it lasts.
Frequently Asked Questions
Q: Why did gas prices jump so fast?
When the Strait of Hormuz — through which roughly 35% of global seaborne crude passes — faces disruption, oil traders reprice risk immediately, even before physical shortages appear. Crude oil is a globally priced commodity, so a supply threat anywhere moves prices everywhere. Since the conflict began in late February 2026, the national average at U.S. gas stations rose from $2.98 to over $4.16 per gallon in about six weeks — the sharpest short-term jump since the 1970s energy crises.
Q: Will gas prices keep going up?
Not necessarily in a straight line. Prices ticked down to $4.03 by late April after a temporary ceasefire was announced. But the World Bank projects Brent to average $86 a barrel for the full year 2026 — well above last year’s $69 average — which means structural upward pressure remains. Expect continued volatility tied directly to conflict developments.
Q: How does this affect everyday grocery prices?
Oil feeds into food costs through two channels: diesel powers the trucks, tractors, and ships that move food from farm to shelf; and natural gas is the primary feedstock for nitrogen fertilizers. With fertilizer prices projected to jump 31% in 2026 (urea up 60%), farmers’ input costs are rising sharply. Those costs take 6–12 months to fully work through to supermarket prices — meaning the worst of the food inflation impact may still be ahead.
Q: Will the Federal Reserve cut interest rates this year?
It now looks unlikely before late 2026 at the earliest. Before the conflict, markets were pricing in at least one cut. The oil shock has changed the calculus: higher energy prices push inflation higher, reducing the Fed’s room to ease. Core PCE inflation was already running at 3.0% in February — above the 2% target — before the energy surge. You can monitor real-time Fed rate expectations via the CME FedWatch Tool or track inflation data at FRED.
Q: Is the U.S. economy headed for a recession?
Not in the base case. The IMF’s April 2026 World Economic Outlook projects U.S. growth at 2.3% for 2026 — still positive, and only a marginal downgrade from January’s forecast. The U.S. benefits from being a net oil exporter: domestic shale producers in the Permian Basin and Bakken formation partially offset the consumer pain. But a sustained escalation — attacks on Saudi or UAE infrastructure, prolonged Hormuz blockage — could change that picture quickly. The IMF’s severe scenario puts global growth at just 2%, which historically borders on recession territory.
Q: What can I actually do to protect my finances right now?
Three practical steps:
- Lock in energy rates. If your utility or heating provider offers fixed-rate plans, consider switching. You’re hedging against further price spikes through winter 2026–2027.
- Review your commute costs. At $4+ per gallon, the calculus on remote work, carpooling, or public transit shifts. The DOE’s fuel economy and EV cost calculator can help you model realistic savings from switching vehicles.
- Delay large rate-sensitive purchases if possible. Mortgage rates won’t move lower until the Fed has confidence that inflation is trending back toward 2%. That moment is unlikely before Q1 2027 under the base case.
Q: Which industries are most exposed to this shock?
The hardest-hit sectors in the U.S.:
- Airlines — jet fuel is 25–30% of operating costs; carriers with limited fuel hedging face acute margin pressure
- Trucking and logistics — diesel-dependent; fuel surcharges are passing costs to shippers and ultimately consumers
- Agriculture — fertilizer costs squeeze farmer margins; higher diesel affects harvesting and distribution
- Food and beverage manufacturing — double exposure via packaging (plastics) and distribution costs
- Retail and e-commerce — freight costs are embedded in every product’s landed cost
The relative winners: domestic oil producers (ExxonMobil, ConocoPhillips, Devon Energy), gold miners, and defense contractors benefiting from increased geopolitical spending.
Q: Where can I track oil prices and energy data myself?
These are the most reliable, free, primary sources:
IMF World Economic Outlook — global growth and inflation forecasts updated twice yearly
U.S. EIA Weekly Petroleum Report — official U.S. government crude and fuel data, updated weekly
AAA Gas Prices — daily national and state-level gasoline averages
FRED – St. Louis Fed — Brent crude price history and economic indicators
World Bank Commodity Markets — quarterly global commodity outlook
Sources: World Bank Commodity Markets Outlook (April 2026), FOMC Minutes (March 18, 2026), IMF Blog (March 30, 2026), Vanguard Economic & Market Outlook (April 2026), U.S. Bank Market Analysis (April 29, 2026), Morgan Stanley Research, San Francisco Fed / Reuters (April 2026).
© Fact and View, 2026. For informational purposes only. Not investment advice..

Be First to Comment