Six months before Americans vote in the November midterms, Wall Street is already repositioning. The S&P 500 has historically delivered its weakest performance of a four-year presidential cycle in midterm years — averaging just 1% return during the calendar year itself, with an average intra-year drawdown of 17.1%. Then, almost without fail, it recovers sharply. The 12 months following a midterm election have produced an average S&P 500 gain of 15.1% going back to 1950.
That pattern has held through 19 of the last 23 midterm cycles. It held after Democratic waves, Republican waves, and divided outcomes. It survived oil crises, the dot-com collapse, and the post-9/11 recession — though not every cycle, and not without exceptions.
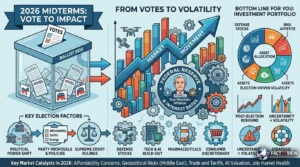
In 2026, that historical rhythm is colliding with an unusually complex macro environment: a $39 trillion national debt, a geopolitical oil shock, an 8-to-4 split at the Fed, a new central bank chair, and affordability anger that has already unseated incumbents in state elections. Understanding how elections actually move the economy and markets — mechanically, not politically — is the most practical financial literacy tool you can apply to the rest of 2026.
The Big Picture: Why the 2026 Midterms Are Different
Every midterm election reshapes Washington’s balance of power. The president’s party has lost seats in 20 of the 22 midterm elections since 1938. On average, the sitting president’s party surrenders 27 House seats and 3 Senate seats, per Capital Group’s January 2026 analysis.
What makes 2026 unusual is the economic and political backdrop. Republican control of Congress is looking vulnerable ahead of the 2026 midterms, and affordability has emerged as the central campaign issue. Grocery prices are up 31% since February 2020. Gas is above $4 a gallon. The average monthly car payment hit $773 — an all-time high. And ACA health insurance subsidies have expired for millions of households, doubling their premiums overnight.
Fact: 60% of respondents in CNBC’s Q1 2026 All-America Economic Survey disapprove of the current administration’s handling of the economy. That number is a reliable leading indicator of midterm seat shifts — when the disapproval rating exceeds 55%, the president’s party historically loses 30+ House seats.
Fact: The administration is actively trying to reverse the political damage. The White House is rolling out targeted measures meant to lower mortgage rates, preserve housing for families, reduce prescription drug costs, and cap credit card interest rates to help ease consumers’ financial burdens. Each of those initiatives has direct market implications regardless of whether they pass.
The View: Elections don’t change the laws of economics. They change the rules under which the economy operates — the tax code, the regulatory environment, the fiscal posture, the trade architecture. In 2026, those rules are already in flux, and the midterm outcome will determine which direction the next two years’ rule changes run. That uncertainty is already priced into market behavior. The question is how much, and what happens when it clears.
Deep Dive: Five Channels from Ballots to Balance Sheets
1. The Uncertainty Discount — and the Post-Election Rally
The most consistent market phenomenon in midterm years is the pre-election uncertainty discount. Markets hate ambiguity. When the composition of Congress is unclear, businesses delay capital decisions, investors reduce risk exposure, and volatility rises.
Fact: The 2026 calendar year falls in the worst year of a presidential cycle for stocks, which historically means equities struggle leading into the midterm election and then experience a clearing-the-deck reset with better results in the late part of the year.
Fact: The S&P 500 has delivered an average pre-midterm return of just 2.9% in the 10 months before election day, versus its long-run historical average of 8.9%. The post-election 12-month average of 15.1% is one of the most durable statistics in capital markets research, per U.S. Bank’s analysis of 125 years of election data.
This isn’t partisan — it’s mechanical. Outside forces explained the negative outcomes for only 11 of the 31 midterm elections studied — those factors included inflation spikes, interest rate hikes, the Great Depression, and wars. The evidence reinforces a practical point: the economy remains the primary engine driving market returns, while elections often shape the narrative more than the outcome.
The View: In 2026, the “outside forces” category is unusually loaded. A geopolitical oil shock, persistent inflation, a new Fed chair, and a $1.9 trillion deficit don’t disappear on election night. The historical post-election rally pattern is real — but it’s not unconditional. The 4 exceptions out of 23 midterm cycles all shared one feature: an economic shock large enough to override political clarity. The question for 2026 is whether the macro environment qualifies.
2. Divided Government — The Market’s Preferred Outcome
Wall Street doesn’t have a party affiliation. It has a preference for gridlock.
Fact: Markets have historically performed well under both single-party rule and divided government. But the path to performance is smoother under divided government — because legislative gridlock reduces the probability of sudden, disruptive policy changes in either direction.
Fact: Based on historical patterns, the 2026 midterm elections are likely to result in some form of divided government, which will limit any form of ambitious legislation and keep debt-to-GDP at a manageable level.
A Democratic takeover of the House — the base case in most forecasting models — would produce exactly this outcome: a Republican Senate and White House, a Democratic House. That configuration can pass budgets but not major tax legislation. It can hold hearings but not override vetoes. It produces noise, not structural policy reversals.
The View: The market is not wrong to find comfort in gridlock. The risk case for markets in 2026 isn’t divided government — it’s either a Republican supermajority that extends the debt trajectory without restraint, or a Democratic wave so decisive it brings structural policy reversals (tax increases, pharma pricing controls) that reprice entire sectors. Both tails are real. Neither is the base case. That is precisely why the S&P 500 tends to rally once the outcome is known: not because the result is good, but because the uncertainty — which was priced in — is gone.
3. Sector-Specific Implications — Winners and Losers by Congressional Outcome
Elections don’t move the market uniformly. They move sectors — and knowing which sectors are exposed to which political outcomes is more actionable than any macro forecast.
Healthcare — The Structural Swing Sector
Healthcare has typically been the best-performing sector in midterm election years. Given recent tailwinds, these stocks may still have room to run in 2026.
Here’s the specific dynamic:
- A Democratic House pushes ACA subsidy restoration, drug pricing negotiation, and Medicaid expansion — headwinds for pharma and managed care margins, tailwinds for hospital utilization
- A Republican hold preserves the current environment — higher premiums, more uninsured patients, favorable conditions for insurer profitability
- Election-year uncertainty itself has historically driven healthcare outperformance as defensive rotation accelerates
Defense and Energy — The Policy Tailwinds
Defense spending under either party is structurally elevated in 2026 — NATO pressure, Indo-Pacific tensions, and the Middle East conflict make military appropriations politically bulletproof. Defense contractors (RTX, LMT, NOC) are relatively insulated from midterm outcomes.
Energy is more contested: a Republican hold accelerates permitting reform and offshore drilling. A Democratic takeover slows both, though the Middle East energy shock has reduced the political appetite for restricting domestic production regardless of party.
Financial Services — The Tariff and Regulation Wildcard
For U.S. equities, the current policy mix — industrial incentives, tax cuts, and AI-driven capex — has supported risk assets and driven opportunities in sectors like technology and manufacturing. But it also means that, looking deeper into 2026, if growth disappoints, fiscal concerns could emerge as a risk factor challenging the market.
Credit card rate caps — a White House priority explicitly tied to the midterm campaign — would directly compress issuer margins. Banks holding large consumer credit portfolios are the most exposed.
Technology and AI
The AI investment cycle is largely independent of midterm outcomes. Capital expenditure decisions at Microsoft, Google, and Amazon aren’t waiting for November. The tariff environment — which affects chip supply chains through Taiwan and South Korea — is more politically sensitive, but the Supreme Court ruling on executive tariff authority (expected before year-end) is a bigger variable than the midterm outcome.
4. The Fiscal Pressure Valve — Debt and Deficits Under Different Configurations
The national debt at $39 trillion is not a partisan problem. It is a structural one. But the path it takes over the next two years is directly determined by the congressional outcome in November.
Fact: There doesn’t appear an obvious political setup to shift policies to deal with elevated U.S. deficits, meaning the burden is on better growth to deal with this issue.
Under a divided government scenario:
- The 2017 Tax Cuts and Jobs Act provisions expiring in 2027 become the central legislative battleground
- A Republican Senate can block tax increases; a Democratic House can block full extension
- The most likely outcome is a partial extension that preserves lower rates for most earners but lets some corporate provisions lapse
Under a Republican hold:
- Full TCJA extension, potentially with additional cuts
- Deficit widens further; bond market pressure on long-term yields intensifies
- Risk: the “bond vigilantes” — large institutional investors who sell Treasuries to protest fiscal profligacy — force a market-driven correction that no one planned for
The View: The fiscal trajectory in 2026 is the market’s most underappreciated election risk. Equity investors focus on tax rates and regulations. Bond investors focus on deficit trajectories and Treasury supply. In a year when the 10-year yield is already at 4.32%–4.45% and Treasury auctions are showing demand weakness, the midterm’s impact on fiscal policy is arguably more consequential for long-run asset prices than any sector rotation. A divided government that prevents further fiscal expansion is, paradoxically, better for bond markets — and ultimately for mortgage rates — than a unified government that extends cuts.
5. The Fed Independence Variable — A 2026-Specific Risk
Most midterm analyses don’t address Federal Reserve independence. In 2026, it’s unavoidable.
Fact: A new Fed chair is to be appointed in 2026 and will likely be ideologically aligned with the administration’s aim to manage the growing U.S. debt pile through lower rates and running the economy hot — a strategy that also increases inflation risks.
Fact: If the U.S. presidential administration issues tariff-related bonus checks to voters ahead of midterm elections, it could stimulate the economy and unleash new price pressures, even as the Fed tries to manage inflation.
A midterm outcome that signals voter anger over affordability increases political pressure on the new Fed chair to cut rates faster than inflation data justifies. That pressure doesn’t override the Fed’s independence — but it does affect the new chair’s calculus about how far to lean against political headwinds.
The View: The intersection of a new Fed chair, a midterm campaign focused on affordability, and a White House applying explicit rate-cut pressure is the most historically unusual element of 2026. It raises the probability of monetary policy error — either cutting too early (reigniting inflation) or staying too long (unnecessary economic pain). Either error has market implications that dwarf the direct effect of any congressional seat change.
To fully understand why interest rate decisions carry so much political and economic weight in 2026, it’s important to understand the institution at the center of the system — including what the Federal Reserve actually does, how it controls interest rates, and why its policies influence everything from inflation to financial markets.
Risks & Opportunities: Three Scenarios
Base Case (~50% probability): Democratic House, Republican Senate
Standard divided government. The legislative agenda freezes on major tax and spending changes. Debt ceiling drama in Q1 2027 creates short-term volatility. The S&P 500 rallies post-election on clarity, delivering the historical post-midterm pattern.
What this means for your money: Tax policy stability through 2027. Healthcare subsidy restoration is possible but constrained. Mortgage rate relief remains a Fed story, not a congressional one. The post-election rally historically runs +15% over 12 months — maintain equity exposure through the pre-election volatility window.
Upside Scenario (~25% probability): Democratic Wave on Affordability
Democrats capture both chambers decisively. White House responds with standalone economic stimulus — targeted tariff reductions, direct consumer relief measures. Short-term consumer spending boost. ACA subsidies restored for 20 million households.
What this means for your money: Insurance premiums decline for millions. Pharma and managed care stocks face pricing pressure. Tariff reductions soften goods inflation. Credit card rate caps compress bank earnings. Net market effect: neutral to slightly positive as consumer relief offsets sector-specific headwinds.
Downside Scenario (~25% probability): Republican Hold, Fiscal Escalation
Republicans retain both chambers. Full TCJA extension advances alongside new spending. Deficit expands from $1.9 trillion toward $2.3 trillion. Bond market “vigilante” response pushes 10-year yields toward 5%. Mortgage rates return to 7%+. Growth slows as capital costs bite.
What this means for your money: Refinancing window closes further. Business investment contracts. The fiscal-monetary conflict intensifies as the Fed holds rates while Treasury supply surges. Gold and TIPS outperform as real asset hedges against fiscal deterioration.
The Bottom Line
Elections are the most over-narrated and under-analyzed variable in personal finance. Everyone watches them. Almost no one uses the data correctly.
For investors:
- The pre-election dip — historically concentrated between June and October in midterm years — is a buying opportunity, not an exit signal
- Focus on fundamentals: prioritize investment strategies that account for the impact of trade, economic growth, and AI trends, rather than react to election headlines that are bound to intensify throughout 2026
- Don’t bet on which party wins. Markets have historically performed well regardless of whether a single party dominates or there’s divided government
- Use the CME FedWatch Tool to track rate expectations — this matters more for your portfolio than any polling average
For consumers:
- Mortgage rate relief is not coming from Congress — it comes from the Fed and the bond market. Track weekly rates at Freddie Mac’s PMMS
- Healthcare insurance costs are directly on the ballot — ACA subsidy restoration is a live policy question. Monitor Medicaid and ACA developments at KFF.org
- Credit card rate caps are a campaign promise, not law. Don’t wait for legislative relief — pay down balances at 20%+ now
For business owners:
- Model your 2027 tax liability across three scenarios: TCJA full extension, partial extension, and expiration. The range is wide enough to materially affect capital investment decisions
- Tariff policy post-Supreme Court ruling is the single most actionable supply chain variable for import-dependent businesses. Follow the case at SCOTUSblog
- Government contract and program continuity should be stress-tested for the divided government scenario — discretionary spending freezes in budget standoffs are reliable features of congressional transitions
The November ballot sets the legislative rules for 2027–2028. It doesn’t change the interest rate environment, the inflation trajectory, or the AI earnings cycle. Those variables — not the partisan composition of Congress — will determine whether your investments grow or contract over the next two years.
Understand the election. Don’t be governed by it.
FAQ
Does it matter which party controls Congress for the stock market?
Less than most people assume. Economic fundamentals — not which party controls Congress — primarily drive equity performance. Investment strategies should remain focused on economic conditions. A portfolio that stayed fully invested through both Democratic and Republican administrations has outperformed one that tried to time political transitions over every measurable long-run period. The S&P 500 has delivered positive 12-month returns after 19 of the last 23 midterm elections — regardless of which party gained or lost. Party control shapes the narrative. Economics drives the outcome. Track the data at Capital Group’s midterm election analysis.
Why does the S&P 500 typically drop before midterm elections?
Markets price uncertainty as risk. Before midterm elections, investors don’t know how the congressional balance of power will change — which creates uncertainty about tax policy, regulation, trade, and fiscal trajectory. That uncertainty is priced into equities as a discount. Historically, this discount manifests as below-average performance in the 6–10 months before election day, with an average intra-year drawdown of 17.1% in midterm years. Once the outcome is known — regardless of which party wins — the uncertainty discount disappears and markets reallocate capital. That’s the post-election rally. It’s not celebration. It’s arithmetic.
What is the “presidential cycle” theory and does it apply in 2026?
The presidential cycle theory observes that stock market performance follows a four-year pattern tied to the presidency: the strongest years tend to be years 3 and 4 (leading into a presidential election), while year 2 — the midterm year — is historically the weakest. The theory holds that incumbent administrations stimulate the economy ahead of presidential elections, creating a recurring performance boost. Year 2 represents the hangover: policy uncertainty, reduced fiscal stimulus, and midterm volatility. The 2026 calendar year falls in the worst year of a presidential cycle for stocks, which historically means equities struggle leading into the midterm election and then experience a clearing-the-deck reset with better results in the late part of the year.
Which sectors perform best in midterm election years?
Healthcare has typically been the best-performing sector in midterm election years. The dynamic: election-year uncertainty drives defensive rotation, and healthcare companies benefit from being both defensively positioned and policy-sensitive (drawing speculative flows from investors anticipating regulatory changes). In 2026 specifically, defense, domestic energy producers, and select financials have sector-specific tailwinds from the current policy environment. Technology faces the most binary risk from tariff and AI regulatory outcomes. Track sector performance in real time at S&P Global’s sector indices.
How do midterm elections affect inflation and interest rates?
Indirectly — but consequentially. The congressional outcome shapes fiscal policy, which affects the federal deficit, which affects Treasury supply, which affects 10-year yields, which affects mortgage rates and borrowing costs across the economy. A divided government that prevents further fiscal expansion reduces Treasury issuance below the current trajectory, creating room for long-term yields to ease. A unified government that expands the deficit adds Treasury supply, pressuring yields upward regardless of Fed policy. The Fed sets short-term rates; the bond market — responding to fiscal signals — sets long-term rates. Track 10-year Treasury yields at FRED.
Should I change my investment portfolio before the November election?
Almost certainly not. The evidence is consistent and strong: view pre-election dips as potential entry points, not reasons to panic. Historically, many of the sharper pre-midterm declines turned into attractive buying opportunities once volatility settled. Stay diversified. Because midterms can affect sectors differently, a well-balanced portfolio can help guard against undue sector-specific swings. If your current portfolio allocation is aligned with your goals and time horizon, discipline — not tactical repositioning — is the evidence-based strategy. Use the pre-election volatility window (historically concentrated June–October) as a dollar-cost-averaging opportunity.
Where can I track the 2026 midterm elections and their market implications?
The most reliable, primary sources:
KFF — ACA & Health Policy Tracker — healthcare policy developments
Capital Group — Midterm Elections & Markets — 23-cycle historical analysis
Morgan Stanley — 7 Political Trends 2026 — sector-by-sector policy implications
U.S. Bank — Stock Market and Midterms — 125-year return data
Ameriprise — 2026 Midterm Election Market Impacts — investor guidance
Brookings Institution — 2026 Election Analysis — nonpartisan political and economic context
CME FedWatch Tool — live rate expectations
Sources: Capital Group — Midterm Elections & Markets, January 2026 · Morgan Stanley — 7 Political Trends 2026 · Morgan Stanley — 2026 Midterms Podcast · Morgan Stanley — Bull Market Risks 2026 · U.S. Bank — Midterm Stock Market Performance · Ameriprise — 2026 Midterm Market Impacts · Silvercrest — Economic & Market Outlook 2026 · Carver Financial — Midterm Elections 2026 Playbook · CNBC All-America Economic Survey Q1 2026
© Fact and View, 2026. For informational purposes only. Not investment advice.


Be First to Comment