
The federal government will spend $7.4 trillion in fiscal year 2026. Every single day, Washington spends approximately $20 billion — more than the GDP of many countries. You fund a significant portion of that through your income taxes, payroll deductions, and every purchase subject to federal excise tax. But here’s what most Americans don’t know: two-thirds of all federal spending goes to benefit payments of one kind or another. Less than 13 cents of every federal dollar pays for the traditional functions of government — roads, courts, diplomacy, scientific research. The rest is a massive redistribution machine, moving money from workers to retirees, from healthy people to sick ones, and increasingly, from all of us to bondholders collecting interest on the national debt.
In 2026, that machine is under direct attack from DOGE, squeezed by record interest costs, and facing the biggest structural choices in a generation. Understanding where your taxes actually go is no longer a civics exercise. It’s a financial survival skill.
The Big Picture: $7.4 Trillion — The Scale of Federal Spending
Federal outlays in 2026 total $7.4 trillion, or 23.3% of GDP, per the Congressional Budget Office’s February 2026 Budget and Economic Outlook. Against that, the federal government collects $5.6 trillion in revenue — leaving a $1.9 trillion deficit that gets financed by issuing new Treasury bonds. Every dollar of that gap adds to a national debt that has already crossed $39 trillion.
Fact: The federal government spent $7.1 trillion in FY 2025. Half of federal revenue came from individual income taxes. Another 34% came from payroll taxes that fund Social Security and Medicare. Corporate taxes contribute roughly 10%. The remainder comes from excise taxes, estate taxes, and tariff revenues that have grown under the current administration’s trade policy.
Fact: Mandatory spending — Social Security, Medicare, Medicaid, and interest — accounts for roughly 65% of the total budget. Discretionary spending covers the remaining 35%. That 65% is not voted on annually. It flows automatically to anyone who meets the legal eligibility criteria — no congressional action required.
The View: The single most important fact about the federal budget is that most of it is on autopilot. Congress debates discretionary spending — defense, education, infrastructure, research — as if that’s where the fiscal battle is fought. It isn’t. The structural drivers of deficit growth are entitlements and interest. DOGE, budget freezes, and agency cuts operate almost entirely in the discretionary space, which means they can never solve the underlying fiscal problem. That’s not a political opinion. That’s arithmetic.
Deep Dive: The Five Buckets That Consume Your Tax Dollars
1. Social Security: The Largest Single Line Item
Social Security is the biggest program the federal government runs. It sends monthly checks to 70+ million Americans — retirees, disabled workers, and surviving family members of deceased workers.
Fact: Social Security spending in FY 2026 is projected at approximately $1.5 trillion — roughly 20% of all federal outlays, per CBO baseline data. It is funded primarily by the 12.4% payroll tax split between employees and employers. But Social Security has been running a structural deficit since 2021: it pays out more than it collects in payroll taxes, drawing down its trust fund reserves.
The growing imbalance inside Social Security is also part of a much broader fiscal challenge tied to America’s rapidly expanding debt and long-term government spending obligations. To better understand the bigger picture, read our analysis on why the rising U.S. national debt is becoming a major economic concern.
CBO projects the Social Security trust fund exhausts its reserves by 2033–2034 — at which point, by law, benefits would be automatically cut by approximately 23% unless Congress acts.
The View: Social Security is the most politically protected program in American government — and the most financially precarious. Every year Congress avoids the solvency conversation, the adjustment required grows larger. The math is not about ideology: a program that pays out more than it collects cannot be sustained by bookkeeping. When the trust fund runs out in 2033, the choice will be between cutting benefits for current retirees or raising taxes on current workers. There is no third option. That decision will define the fiscal politics of the late 2020s — and it will directly affect every American’s retirement planning.
Economists warn that unresolved debt pressures, entitlement costs, and rising borrowing expenses could eventually become a much larger risk for the broader economy if structural reforms continue to be delayed. Read our full breakdown of whether the U.S. economy could face a deeper financial crisis in the years ahead.
2. Healthcare: Medicare, Medicaid, and the Spending Engine
Federal healthcare spending is the fastest-growing major budget category — and the hardest to control, because it is driven by an aging population and rising medical costs that no policy can simply legislate away.
Those rising costs are also heavily influenced by inflation, interest rates, and broader monetary policy decisions that shape borrowing conditions across the entire economy. Learn more about how the Federal Reserve influences inflation, financial conditions, and the U.S. economy.
Fact: Combined federal spending on Medicare, Medicaid, the Children’s Health Insurance Program (CHIP), and marketplace subsidies totals approximately $1.9 trillion in FY 2026 — more than 25% of the entire federal budget. Medicare alone covers 67 million Americans aged 65 and older, or those with qualifying disabilities.
Fact: House Republicans released a plan in May to cut Medicaid spending by $880 billion over ten years, including adding work requirements and eligibility checks. Medicaid administrator Mehmet Oz stated that approximately $14 billion has been identified in duplicate enrollments — people wrongly enrolled in multiple states simultaneously. Even if those savings are real and recoverable, they represent less than 1% of total projected Medicaid spending over the decade.
The View: The Medicaid debate playing out in Congress right now is genuinely consequential — but it is also structurally limited. Discretionary spending is only a quarter of the federal budget and, by itself, would not reach DOGE’s $2 trillion savings goal. If lawmakers are serious about reaching that benchmark, it’s inevitable that mandatory programs like Social Security, Medicare, and Medicaid will experience some kind of cut. The political resistance is enormous: both parties have constituents who depend on these programs. But the fiscal math is equally clear — federal health care programs and Social Security make up 60% of projected spending growth over the next 10 years.
3. Defense and Security: Past $1 Trillion for the First Time
National defense has always commanded a major share of the federal budget. In 2026, it crosses a threshold that no previous administration has reached.
Fact: The FY 2026 budget proposal increases defense spending by 13%, pushing it past $1 trillion for the first time ever, while slashing non-defense discretionary spending by $163 billion — a 22.6% cut to that category. Defense spending at $1 trillion+ represents roughly 13–14% of total federal outlays — substantial, but still far smaller than mandatory spending categories.
Defense spending in 2026 is driven by three concurrent pressures:
- The Middle East conflict — active U.S. military operations and force projection costs
- NATO and European security commitments — expanded deployments and equipment transfers post-Ukraine
- Indo-Pacific deterrence — naval and air force buildup in response to China’s military modernization
The View: The $1 trillion defense threshold matters symbolically — but the scale illusion matters more. Defense is 13% of the budget and is being increased. Social Security and healthcare are 45%+ of the budget and are structurally growing. DOGE focuses on discretionary non-defense spending, which is less than 15% of total outlays. The fiscal arithmetic is brutally clear: you can cut every dollar of non-defense discretionary spending and still not close the deficit. It is structurally impossible to solve the federal fiscal problem without addressing mandatory spending — which neither party is currently proposing to do in any meaningful way.
4. Interest on the Debt: The Fastest-Growing Budget Category
Interest on the national debt is now the most consequential budget line that most people never think about — and the one with the most direct impact on every other government function.
Fact: Net interest payments will total $1.0 trillion in FY 2026 — the first time in U.S. history that debt service exceeds $1 trillion in a single year. Interest payments now exceed total defense spending. Within a decade, interest is projected to consume 31% of all federal revenues. By 2056, it could consume more than half.
Fact: The interest cost explosion is the product of two converging forces: a debt that has grown from $900 billion in 1980 to $39 trillion today, and interest rates that have risen from near-zero in 2021 to 3.5%–3.75% on short-term instruments and 4.3%–4.45% on 10-year Treasuries. When you refinance debt at higher rates, the carrying cost rises even without new borrowing.
The View: Interest is the budget category that crowds out everything else. Every dollar paid to bondholders is a dollar not available for research, infrastructure, education, or defense. And unlike Social Security or Medicare — which at least deliver services to Americans — interest payments deliver nothing to U.S. citizens. They are the pure cost of past decisions. The structural tragedy of the current fiscal situation is that interest costs are on a self-reinforcing path: higher debt means higher interest costs, which means higher deficits, which means more debt. Breaking that cycle requires a primary surplus — spending less than you collect before interest payments — that the U.S. has not achieved since FY 2001.
5. Discretionary Spending: The 35% That Congress Actually Controls
Discretionary spending covers everything from the military paycheck to the FDA food inspector to the National Weather Service meteorologist to the Pell Grant that helps a first-generation college student afford tuition.
Fact: Total discretionary spending in FY 2026 is budgeted at approximately $1.7 trillion — down from $1.83 trillion — split between defense (roughly $1 trillion) and non-defense discretionary ($700 billion). At its proposed level, non-defense discretionary spending would be the lowest since 2017, or adjusted for inflation, the lowest since 2000.
Key non-defense discretionary programs at risk in 2026:
- Education — Pell Grants, Title I K-12 funding, Head Start
- Transportation — highway and airport infrastructure investment
- Scientific research — NIH, NSF, NASA (proposed nearly 50% cut to NASA budget)
- Environmental protection — EPA enforcement and climate programs
- Foreign aid and diplomacy — State Department and USAID operations
- Housing assistance — Section 8 vouchers and HUD programs
Fact: DOGE’s efforts appear to have resulted in roughly a 10% reduction in the size of the civilian government workforce, allowing for $20 billion or more in spending cuts — meaningful, but amounting to less than 0.3% of total federal spending. DOGE’s original $2 trillion savings target was revised down to $150 billion for FY 2026.
The View: Discretionary cuts are politically visible and symbolically significant — but fiscally insufficient. Eliminating every dollar of non-defense discretionary spending would reduce the deficit by roughly $700 billion annually. The projected deficit is $1.9 trillion. That leaves $1.2 trillion in gap that can only come from mandatory spending or revenue increases. Politicians who promise to fix the fiscal problem through discretionary cuts alone are describing a solution that covers 37 cents of every deficit dollar. The remaining 63 cents is the conversation no one wants to have.
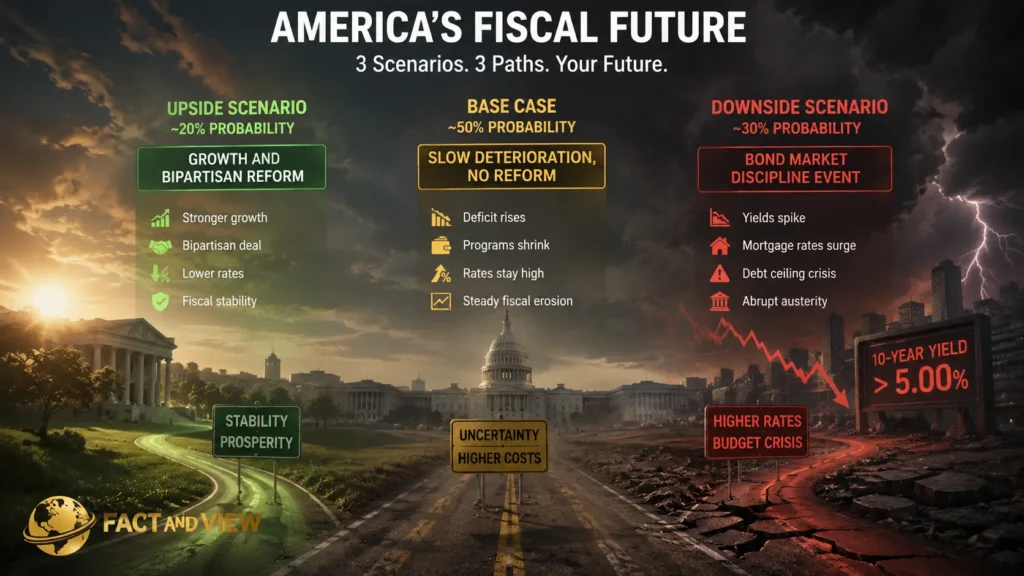
Risks & Opportunities: Three Budget Scenarios
Base Case (~50% probability): Slow Deterioration, No Reform
The OBBBA’s tax provisions are partially extended. Discretionary cuts stick but don’t expand. Mandatory spending grows at its projected pace. The deficit rises toward $2.1 trillion by FY 2028. Debt approaches 110% of GDP by 2030. Interest payments consume 18–20% of revenue. No acute crisis — just steady fiscal erosion.
What this means for you: Federal programs face quiet compression. SNAP benefits, housing vouchers, and research grants shrink in real terms. Mortgage rates stay elevated as Treasury supply remains heavy. The tax burden shifts gradually upward for middle-income earners as bracket creep and expiring provisions take effect.
Upside Scenario (~20% probability): Growth and Bipartisan Reform
AI-driven productivity pushes GDP growth above 2.5% sustainably. Higher revenues narrow the deficit organically. A bipartisan fiscal deal — forced by bond market pressure — stabilizes the debt trajectory through modest entitlement reforms and revenue adjustments. Long-term yields ease, mortgage rates fall.
What this means for you: The “fiscal drag” on long-run growth lifts. Federal programs stabilize. Borrowing costs ease. This scenario requires political will that has been absent for two decades — but bond market discipline has forced fiscal reform in other high-debt democracies (Canada, Sweden, the UK) and could do so here.
Downside Scenario (~30% probability): Bond Market Discipline Event
Sustained weak Treasury demand — already visible in March 2026’s poor auctions — escalates. The 10-year yield breaks above 5%. Mortgage rates return to 7.5%–8%. A debt ceiling standoff in Q1 2027 disrupts Treasury payments. Emergency fiscal austerity arrives suddenly rather than gradually.
What this means for you: This is the scenario where the slow burn becomes visible. Mortgage rates at early-1980s levels. Federal program cuts arrive without political process — because the bond market has already decided. Businesses with government contract exposure face abrupt revenue disruption.
The Bottom Line
The federal government’s spending machine is not broken. It is working exactly as designed — sending $1.5 trillion to Social Security recipients, $1.9 trillion to healthcare programs, $1 trillion to service the debt, and $1 trillion to defense. The problem is that this machine costs $1.9 trillion more per year than the country collects in taxes. And the gap is widening.
For taxpayers:
- Your income taxes and payroll taxes fund specific things: income taxes go to the general fund (discretionary spending and interest); payroll taxes go directly to Social Security and Medicare trust funds. Understanding this distinction matters when you evaluate politicians’ claims about what their proposals actually affect
- Social Security’s 2033 trust fund depletion is a personal retirement planning issue — not just a political abstraction. If you’re under 55, model your retirement cash flows with a 20–25% reduction in projected Social Security benefits as a contingency scenario
- Track where your tax dollars go in real time at USASpending.gov — the official federal spending transparency platform
For investors:
- The crowding-out effect of $1 trillion in annual interest costs is a structural headwind on productive government investment. Less infrastructure, less research, less education spending means slower long-run productivity growth — and lower long-run equity returns
- Treasury Inflation-Protected Securities (TIPS) at 1.25%–2.0% real yields are attractive precisely because fiscal deterioration raises long-run inflation risk
- Municipal bonds remain efficient for investors in higher tax brackets — and their credit quality benefits from local governments not facing the same structural deficit dynamics as the federal government
For business owners:
- Federal contracts and grants are now subject to DOGE-era scrutiny and appropriations uncertainty. Build 90-day contingency plans for any revenue stream that flows from federal discretionary programs
- Tax policy uncertainty is now a permanent feature of the planning environment. Model your 2027–2028 liability across full TCJA extension, partial extension, and expiration scenarios. The range between best and worst case is wider than at any point since 2000
The federal budget is not an abstraction. It is the operating system of the American economy — and right now, it has a structural deficit that its designers haven’t fixed in 25 years. The consequences of that failure are already arriving in the form of elevated mortgage rates, compressed federal services, and a mounting interest bill that grows with or without any new policy decision.
Understanding where your taxes go doesn’t change the system. But it does let you plan around what the system is actually doing — rather than what politicians claim it does.
FAQ
How much does the US federal government spend in 2026?
Federal outlays in 2026 total $7.4 trillion, or 23.3% of GDP, per CBO’s February 2026 Budget and Economic Outlook. That equals approximately $20 billion per day, $22,000 per American household, or roughly 2.3x what the federal government spent in 2000 even after adjusting for inflation. The gap between spending ($7.4 trillion) and revenue ($5.6 trillion) produces a $1.9 trillion deficit — financed by issuing new Treasury bonds. Track daily spending in real time at USASpending.gov and official CBO projections at CBO.gov.
What is mandatory vs. discretionary spending?
Mandatory spending is governed by eligibility rules written into law. Anyone who meets the statutory criteria for Social Security, Medicare, or Medicaid receives the benefit automatically — Congress does not need to appropriate funds each year. Discretionary spending requires Congress to pass appropriations bills each year to authorize and fund it. Mandatory spending accounts for roughly 65% of all federal outlays; discretionary covers 35%. The key implication: DOGE, budget freezes, and congressional spending fights almost entirely address the 35% that Congress controls annually. The 65% that drives long-run fiscal deterioration is largely untouched by the current political debate.
What is DOGE actually cutting, and does it matter fiscally?
DOGE — the Department of Government Efficiency — targeted discretionary spending, federal contracts, and the civilian workforce. DOGE’s efforts appear to have resulted in roughly a 10% reduction in the size of the civilian government workforce, allowing for $20 billion or more of spending cuts. DOGE’s original $2 trillion savings target for FY 2026 was revised down to $150 billion — and actual achieved savings appear to be lower still. In context: $20–$150 billion represents 0.3%–2% of the $7.4 trillion federal budget and does not materially alter the structural deficit trajectory, which requires addressing mandatory spending growth.
What percentage of my income taxes goes to Social Security and Medicare?
Nothing — directly. Your Social Security and Medicare contributions come from a separate payroll tax (FICA): 7.65% of your wages, matched by your employer (12.4% total for Social Security up to $168,600, and 2.9% for Medicare with no cap). Your federal income tax goes to the general fund, which pays for defense, interest on the debt, discretionary programs, and supplements mandatory programs when trust fund revenues fall short. Half of federal revenue comes from individual income taxes. Another 34% comes from the payroll taxes that fund Social Security and Medicare.
When will Social Security run out of money?
Social Security’s combined trust funds are projected to be exhausted by 2033–2034, according to the latest Social Security Trustees Report. After exhaustion, incoming payroll tax revenues would cover approximately 77% of scheduled benefits — meaning benefits would be automatically cut by roughly 23% under current law, unless Congress acts before then. This is not a distant hypothetical: it is 7–8 years away, affecting everyone currently between 57 and 64 who expects to retire at full benefit. Read the official trustees report at SSA.gov/OACT/TR.
Why does the US pay so much in interest on the debt?
Two compounding factors. First, the debt itself has grown from $5.6 trillion in 2000 to $39 trillion in 2026 — a nearly 7-fold increase driven by tax cuts, spending expansions, and emergency stimulus packages. Second, interest rates have risen from near-zero in 2020–2021 to 3.5%–4.45% across different maturities. When existing debt matures and is refinanced at higher rates, the carrying cost rises even without new borrowing. Net interest payments reached $1 trillion in FY 2026 — surpassing defense spending for the first time. Interest is projected to consume 31% of all federal revenues within a decade. Track the real-time interest cost at PGPF Interest Tracker.
Where can I track US government spending in real time?
The most reliable, primary, free sources:
OMB Historical Tables — official Office of Management and Budget spending data going back to 1940
USASpending.gov — official federal spending transparency database; searchable by agency, program, and contract
CBO Budget and Economic Outlook 2026 — the definitive 10-year spending and deficit projection
Brookings 2026 Chart Book — 132-page nonpartisan visual breakdown of spending, taxes, and deficits
USAFacts Federal Budget Tracker — plain-language annual budget breakdown with charts
CRFB Deficit Tracker — real-time deficit and debt analysis
PGPF Interest Cost Tracker — monthly federal interest payment data
Sources: CBO Budget and Economic Outlook, February 2026 · USAFacts Federal Budget Report 2026 · Brookings 2026 Spending Chart Book · CRFB FY 2026 Appropriations Analysis · CBS News — Trump FY 2026 Budget Proposal · NPR — Trump Budget Cuts · AllSides — DOGE Cuts Tracker · Yahoo Finance — DOGE Impact on Wallet · Politics News Plus — Federal Budget 2026 · PGPF Interest Cost Tracker
© Fact and View, 2026. For informational purposes only. Not investment advice.


Be First to Comment