

Two retailers can sell nearly identical products at nearly identical prices and still deliver completely opposite stock performance in the same quarter — one riding a wave of resilient spending, the other warning investors that its core customer has simply run out of money before the month ends. The difference between those two outcomes increasingly comes down to a single underlying variable that rarely appears in a retailer’s own earnings headline: consumer debt.
Total U.S. household debt reached a record $18.8 trillion in early 2026, according to the Federal Reserve Bank of New York — a figure large enough to sound abstract until you connect it to something much more concrete: whether the shopper walking into a Target, a Dollar General, or a Home Depot this weekend is spending freely or quietly relying on a credit card to bridge the gap between their paycheck and their bills.
For investors, understanding that connection isn’t optional trivia. It’s one of the clearest, most consistently useful lenses for interpreting retail sector performance — and for separating retailers built to weather a debt-strained consumer from those that aren’t.
What Is Consumer Debt?
Consumer debt refers to the total money owed by individuals and households for personal, non-business purposes — everything from mortgages and auto loans to credit card balances and student loans.
Fact: The Federal Reserve Bank of New York tracks this figure quarterly through its Consumer Credit Panel, built from a nationally representative sample of Equifax credit report data. As of the first quarter of 2026, total household debt stood at $18.8 trillion, broken down primarily into mortgage balances (roughly $13.2 trillion), credit card balances ($1.25 trillion), auto loans (roughly $1.66 trillion), and student loans (roughly $1.65 trillion).
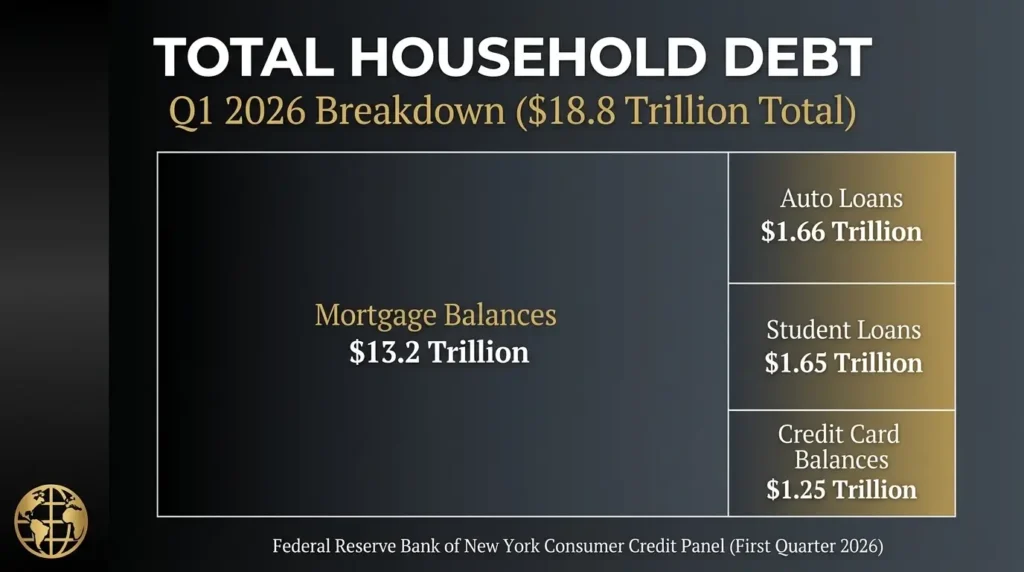
Fact: Not all consumer debt carries the same investment significance. Mortgage debt is generally considered comparatively low-risk from a spending standpoint, since it reflects a fixed, long-term obligation tied to an appreciating asset, and mortgage delinquency rates have remained historically low. Revolving debt — primarily credit card balances — is the category analysts watch most closely for retail sector signals, because it directly reflects short-term financial strain and expands or contracts in near-real time with a household’s ability to cover everyday expenses.
The View: The most important distinction for any investor to internalize is between debt that reflects confidence and debt that reflects necessity. A household using a credit card to finance a discretionary vacation is sending a very different economic signal than one using it to cover this month’s groceries after a job loss. Both show up identically in the aggregate credit card balance figure — but they predict opposite things about future retail spending.
Related reading: Why Credit Card Debt Is Exploding in America — a deeper look at what’s driving record credit card balances and who is carrying the heaviest burden.
Why Consumer Debt Matters for Retail Stocks
Retail stocks are, structurally, a direct bet on discretionary consumer spending — which makes them uniquely sensitive to the health of household balance sheets in a way that many other equity sectors simply aren’t.
Fact: Consumer spending accounts for approximately two-thirds of U.S. GDP, making it the single largest driver of economic activity — and retail companies sit at the most direct point of contact with that spending. When household debt service costs rise faster than income, less disposable income remains for the discretionary purchases that drive retail earnings growth.
Fact: Elevated consumer borrowing rates compound this pressure. Even as the Federal Reserve has periodically cut its benchmark rate, consumer borrowing rates on credit cards and mortgages have remained stubbornly elevated relative to those cuts, according to Fidelity Institutional’s sector analysis — meaning the relief from Fed policy doesn’t always translate quickly into relief for indebted households.
Fact: A widening gap between corporate and consumer financial health has become one of the defining features of the current market. As one Motley Fool analysis put it, there’s “a growing divide between the strength of corporate balance sheets and consumers” — business-to-business and AI-infrastructure-linked companies have continued posting strong results, while many consumer-facing retail and restaurant stocks have been “getting hammered” by comparison.
The View: This divergence is precisely why consumer debt deserves more attention from retail investors than it typically receives. A retailer can report solid same-store sales growth driven almost entirely by inflation-driven price increases rather than genuine volume growth — a distinction that becomes visible only when you cross-reference earnings commentary against household debt and delinquency data. Debt levels function as a leading indicator of retail earnings quality, not just retail earnings quantity.
Related reading: What the Federal Reserve Really Does — how Fed interest rate decisions flow through to consumer borrowing costs and, eventually, retail spending power.
How Consumer Spending Drives Retail Earnings
The mechanical relationship between consumer debt and retail earnings runs through a fairly direct chain of cause and effect, even though it doesn’t always show up immediately in headline sales figures.
Fact: Bank of America’s Consumer Checkpoint research — drawn from aggregated card spending data — found that total credit and debit card spending per household rose 4.3% year-over-year as of one recent measurement, the strongest gain in several years. But that headline figure masked a sharp divergence: higher-income households’ spending rose 3.9% year-over-year, compared with just 2.2% for lower-income households, whose wage growth continued lagging behind higher earners.
Fact: More than half of consumers — 53%, according to debt management company Achieve — now carry credit card balances specifically to cover essential expenses like groceries, utilities, and housing, rather than discretionary purchases. As Achieve’s analysts noted, “for many households, higher balances are less a sign of economic optimism and more a sign that wages and savings are struggling to keep pace with essential expenses.”
Fact: This distinction directly explains diverging retail earnings results. Cautious commentary from major retailers about “customers under pressure” and pulled-back discretionary spending reflects the same underlying dynamic showing up in New York Fed debt data: households increasingly stretched thin are prioritizing necessities over discretionary big-ticket purchases.
The View: The practical takeaway for anyone reading a retail earnings report is to separate the topline revenue number from the story behind it. Revenue growth driven by rising prices on a shrinking basket of goods is a fundamentally different — and less durable — story than revenue growth driven by more customers buying more things because they feel financially secure enough to do so. Consumer debt trends are one of the clearest tools available for telling the two apart before the market fully prices in the difference.
Which Retail Sectors Are Most Affected?
Not every corner of the retail sector responds identically to rising consumer debt — and the divergence between them offers some of the most useful investment signals available.
Discount and value retailers show a mixed, income-dependent picture. Conventional wisdom holds that discount retailers benefit when stretched consumers “trade down” from pricier alternatives. That has proven true for some chains but not others. Retailers with a broader customer base spanning multiple income tiers and a large grocery component have generally weathered debt-driven consumer strain better than deep-discount chains serving a narrower, lower-income customer base. Deep-discount retailers whose core customers earn under roughly $40,000 annually have, in some periods, faced a different dynamic entirely: rather than gaining new trade-down customers, their existing customer base showed signs of being financially exhausted — running out of money before the end of the month rather than having more to spend.
Home improvement retailers are highly interest-rate sensitive. Because large home improvement projects are frequently financed through home equity lines of credit or personal loans, this category responds acutely to both consumer debt levels and borrowing costs. Elevated rates have pushed spending toward smaller maintenance and repair projects rather than larger discretionary renovations.
Auto-related retail has shown surprising resilience. Auto parts and equipment retailers have periodically outperformed broader retail, driven by a debt-related dynamic: as elevated auto loan rates and vehicle prices push consumers to hold onto existing vehicles longer, replacement parts demand rises even as new vehicle purchases soften.
Luxury and premium retail faces its own debt-adjacent pressure. Rising tariff costs, price-sensitive customers, and heightened competition have weighed on luxury and footwear retailers, even though their customer base is typically less directly exposed to consumer debt strain — illustrating that debt dynamics interact with, rather than fully replace, other sector-specific pressures.
Financial services tied to consumer lending amplify the signal further. Auto lenders have seen sharp share-price reactions after warning of “intensifying credit challenges,” with serious auto loan delinquencies reaching multi-decade highs in some periods — a reminder that consumer debt stress shows up not only in retailer earnings but in the lenders financing those same consumer purchases.
Related reading: Interest Rates Explained: How They Affect Your Money — the mechanics connecting Fed policy to the auto loan and credit card rates driving these sector divergences.
What Investors Should Watch
A handful of specific, publicly available data points offer the clearest ongoing signal of how consumer debt is likely to affect retail stock performance.
- The New York Fed’s Quarterly Report on Household Debt and Credit — released every quarter, this is the single most authoritative source for tracking total debt levels, credit card balances, and delinquency transition rates by debt category.
- Delinquency rates by debt type, not just the aggregate figure — credit card and auto loan delinquencies have historically moved earlier and more sharply than mortgage delinquencies, making them a more sensitive early-warning indicator for retail-adjacent stress.
- Bank earnings commentary on card spending volumes, broken out by income tier where available — major banks report debit and credit card spending trends quarterly, often with income-based segmentation that reveals the K-shaped dynamic before it shows up in retailer results.
- Retailer commentary on trade-down behavior versus outright pullback — earnings call language distinguishing between customers switching to cheaper products (trade-down) versus reducing purchase frequency altogether (pullback) signals meaningfully different depths of consumer stress.
- The “K-shaped” spending gap between income terciles, tracked in institutional research such as Bank of America’s Consumer Checkpoint — the width of this gap has proven to be a leading indicator for which retail categories will outperform or underperform in subsequent quarters.
Can Retail Stocks Outperform During High Debt Levels?
High aggregate consumer debt does not automatically mean poor retail stock performance — a nuance that matters enormously for investors tempted to treat a large headline debt figure as an automatic red flag.
Fact: Bankrate’s principal analyst has noted that despite record debt totals, the household debt-to-income ratio has remained relatively low by historical standards, and roughly 70% of total household debt is mortgage debt — generally considered “good debt” in the sense that it builds home equity rather than financing consumption. Aggregate debt size alone, without context on composition and serviceability, tells an incomplete story.
Fact: Retail sector financial health at the corporate level has remained comparatively strong even as consumer debt has risen. The broader consumer discretionary sector has maintained relatively low leverage and strong interest coverage on a balance-sheet basis — earnings covering interest expense by a wide multiple in recent measurements — suggesting well-capitalized retailers are structurally positioned to withstand a period of consumer belt-tightening better than headline debt figures alone would suggest.
Fact: Historical precedent supports selective outperformance during elevated-debt periods. Retailers serving resilient, higher-income consumer segments, or offering products with inelastic demand — groceries, essential household goods, auto replacement parts — have periodically outperformed the broader retail sector even while aggregate consumer debt and delinquency figures were rising, precisely because their specific customer base was less exposed to the debt strain showing up in the aggregate data.
The View: The relationship between consumer debt and retail stock performance is not a simple inverse correlation where rising debt automatically means falling retail stocks. It’s a segmentation story. Rising aggregate debt, combined with a widening K-shaped divergence between income groups, tends to reward retailers serving financially resilient customers while punishing those most exposed to financially stretched ones — meaning the aggregate debt headline matters less to any individual retail stock than which specific customer base that retailer actually serves.
Key Risks and Opportunities for Long-Term Investors
The primary risk is treating any single debt metric in isolation. Aggregate household debt, credit card balances, and delinquency rates each tell a partial story; the K-shaped divergence between income groups is frequently the more decisive variable for retail stock performance than the topline debt figure itself.
A second risk involves timing. Consumer debt and delinquency data tend to be leading indicators for consumer-facing earnings, but the lag between rising delinquencies and visible retail earnings deterioration can extend across several quarters, tempting investors into premature or delayed positioning.
The clearest opportunity lies in the structural divergence itself. Retailers with diversified income-tier customer bases, essential-goods exposure, or genuine value propositions for cost-conscious consumers have historically demonstrated more durable performance through periods of rising consumer debt stress than retailers dependent on discretionary, credit-financed purchases.
A second opportunity involves financial services and lending-adjacent equities, which often reveal consumer credit stress before it becomes visible in retailer earnings commentary — making bank and auto-lender earnings calls a genuinely useful leading indicator for retail sector positioning, not just a separate sector to analyze independently.
The Bottom Line
Consumer debt is not a single number to watch — it’s a lens for interpreting retail sector performance that rewards investors willing to look beneath the aggregate headline. A record-setting household debt total sounds alarming as a standalone figure, but its actual investment significance depends entirely on composition (mortgage versus revolving debt), distribution (which income groups are carrying the strain), and trajectory (rising or stabilizing delinquency rates).
For long-term investors, the practical discipline is straightforward: read retail earnings alongside New York Fed debt data, not instead of it. A retailer beating earnings expectations during a period of rising delinquencies and widening K-shaped spending gaps deserves closer scrutiny than the headline suggests — and a retailer facing near-term pressure while serving a genuinely resilient customer base may be better positioned than its stock price currently reflects.
Sources: Federal Reserve Bank of New York — Quarterly Report on Household Debt and Credit, Q1 2026 · Federal Reserve Bank of New York — Household Debt and Credit Background · CNBC — Credit Card Debt Tops $1.28 Trillion, K-Shaped Economy · CNBC — Credit Card Debt Dips to $1.25 Trillion · U.S. News — Household Debt at New High · Yahoo Finance — Household Debt Stands at a Historic High · FinancialContent — The $18 Trillion Debt Wall · Bank of America Institute — Consumer Checkpoint, April 2026 · Fidelity Institutional — Consumer Discretionary Sector Outlook · The Motley Fool — Debt and Housing Metrics Investors Should Watch · The Motley Fool — What Bank Earnings Revealed About the American Consumer · CSIMarket — Consumer Discretionary Sector Financial Strength
© Fact and View. For informational purposes only. Not investment advice.