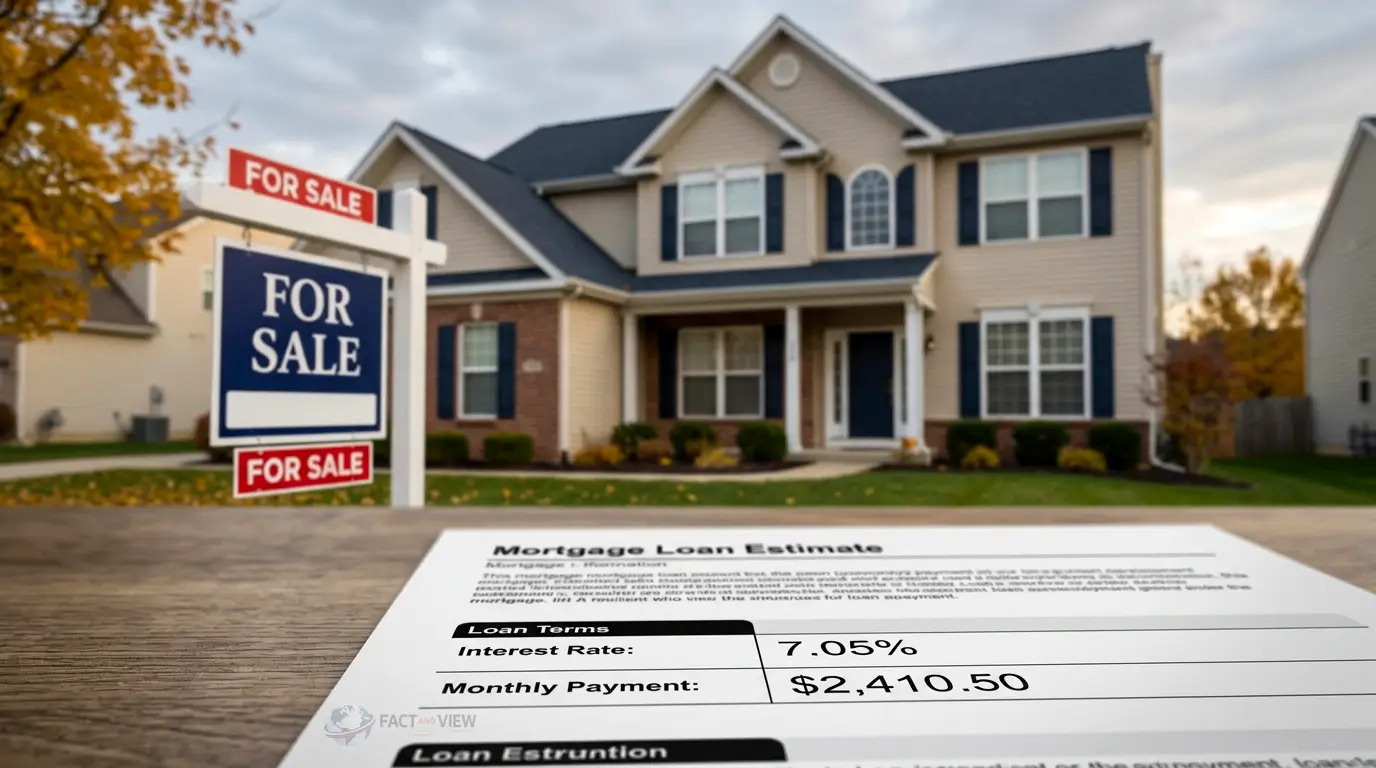
The average 30-year mortgage rate is sitting around 7% again, roughly where it stood right after the Federal Reserve’s last rate hike back in August 2023. For anyone house hunting this fall, that number is the difference between a monthly payment that fits the budget and one that doesn’t.
Mortgage rates spent early 2026 near 5.75%, a level that made homeownership feel newly reachable for a lot of buyers. Then they climbed nearly a full two percentage points over the following months, culminating in the Federal Reserve’s decision on September 16 to raise its benchmark interest rate for the first time in more than three years. Understanding why that happened, and why a Fed rate hike doesn’t map onto mortgage rates in a simple, one-to-one way, explains most of what’s currently happening in the housing market.
The Big Picture
Mortgage rates don’t move because the Fed says so directly. They move because of what bond investors expect the Fed to do, months in advance, which is why mortgage rates were already above 7% before the Fed’s meeting even happened. The rate hike itself confirmed a trend that had been building for months rather than starting a new one.
What Happened
The average rate on a 30-year fixed mortgage was running in the 6.95% to 7.37% range in the days following the Fed’s September 16 decision, according to surveys from Freddie Mac, Zillow and Bankrate. The exact figure differs slightly depending on which survey you check. Freddie Mac’s weekly survey of large lenders, widely considered the industry benchmark, put the 30-year average at 6.95% to 6.97%; Zillow’s daily lender data, which tends to run a bit higher and updates more frequently, showed the 30-year average moving between 7.0% and 7.37% over the same stretch.
Both readings represent a sharp climb from where rates stood just months earlier. In early March 2026, the 30-year average was 5.75%, according to Zillow data. The move higher since then, nearly two full percentage points, is one of the more significant mortgage rate swings in recent years.
The Federal Reserve’s rate decision was the headline event of the week. The central bank raised its benchmark federal funds rate by a quarter percentage point to a range of 3.75% to 4%, its first increase since 2023, in a unanimous vote. Fed Chair Kevin Warsh, who took over the role in May, cited persistently elevated inflation as the reason, telling reporters the Fed still has “work to do” to bring price growth back to its 2% target. The move came even as President Trump had publicly expressed a preference for lower interest rates, a detail worth noting as background without implying anything about the Fed’s independence or motives, since the Fed’s decision was unanimous among its own policymakers.
“Why Prices Are Still Rising in 2026 — Even as Inflation Cools” — background on the inflation dynamics shaping the Fed’s current policy stance.
Why Mortgage Rates Are Still So High
Three forces have combined to push mortgage rates higher this year, and none of them is simply “the Fed raised rates.”
Inflation stayed elevated. The Consumer Price Index rose 3.4% over the twelve months ending in August, well above the Fed’s 2% target, according to the Bureau of Labor Statistics. Persistent inflation is exactly the condition that pushes both the Fed and bond investors toward higher rates, since lenders demand more compensation for lending money that will be repaid in dollars likely to be worth less by the time the loan matures.
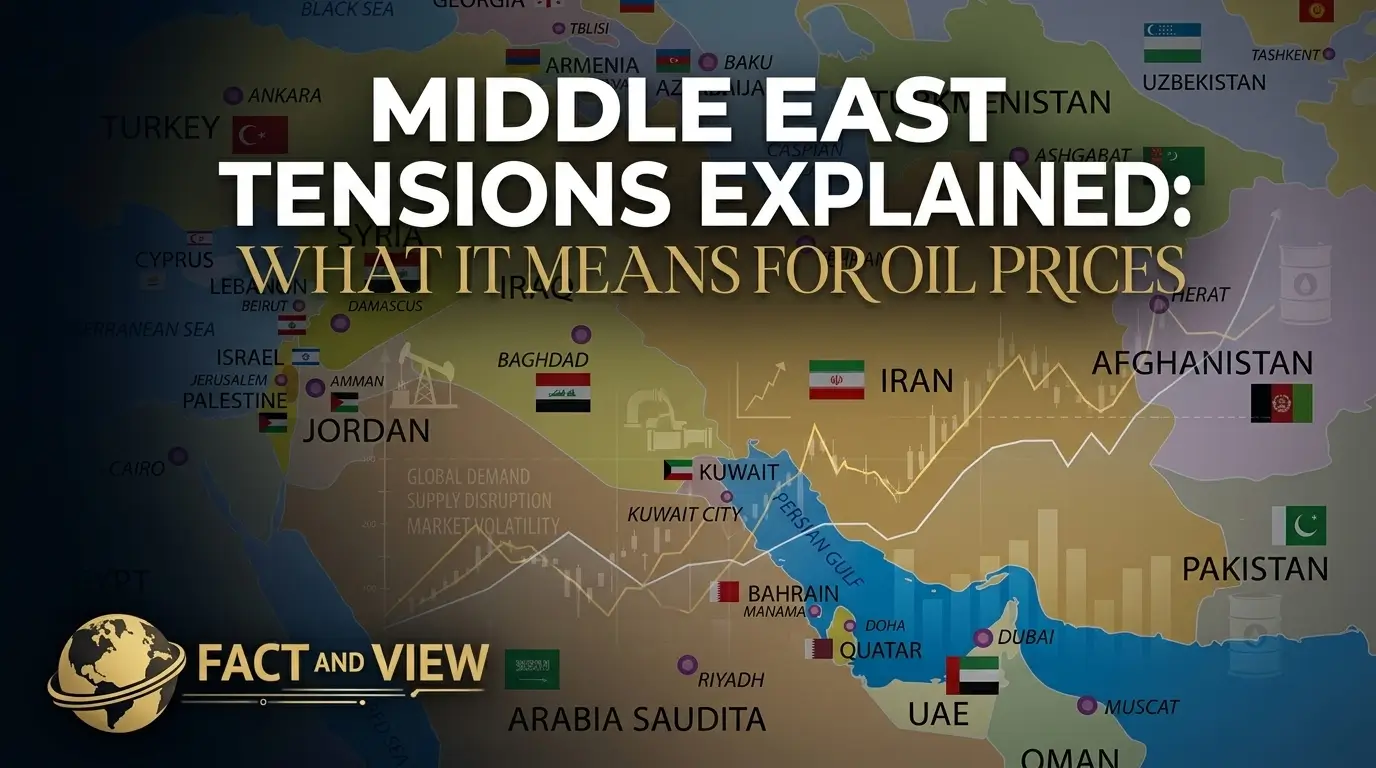
Oil prices surged. Crude prices moved above $100 a barrel following the escalation of the conflict involving Iran and disruptions around the Strait of Hormuz, a critical global oil shipping route. Higher energy costs feed directly into inflation readings, reinforcing the same upward pressure on rates described above.
The 10-year Treasury yield climbed sharply. Mortgage rates track the 10-year Treasury yield more closely than they track the Fed’s own benchmark rate, and that yield approached 5% in the days around the Fed’s meeting, its highest level since 2007, according to Mortgage News Daily and multiple lender rate surveys. Bond investors pushed yields higher in anticipation of the Fed’s hike and in response to the same inflation and energy pressures described above.
“How Inflation Affects Your Savings” — related coverage of how the same rate environment affects savers, not just borrowers.
How the Fed-to-Mortgage Connection Actually Works
This is the part that trips up a lot of homebuyers: the Federal Reserve doesn’t set mortgage rates. It sets the federal funds rate, the rate banks charge each other for overnight lending, which is a different market entirely from the 30-year mortgage market.
Here’s the actual chain of cause and effect. Mortgage-backed securities, bundles of home loans sold to investors, compete for the same investor money as U.S. Treasury bonds. When investors expect the Fed to keep rates higher for longer, or to keep raising them, they demand higher yields on both Treasury bonds and mortgage-backed securities to make holding those investments worthwhile. Mortgage lenders then price new loans off those higher yields, since they need to sell the resulting mortgages to investors at a competitive return.
Put another way, a mortgage lender isn’t simply picking a rate; it’s pricing a loan that will ultimately be packaged and sold into the same capital markets where Treasury bonds trade. If a 10-year Treasury bond suddenly offers a higher, safer return, mortgage-backed securities have to offer a comparably higher return to attract the same pool of investors, and that higher required return gets built directly into the interest rate a borrower is quoted at the closing table.
This is why mortgage rates often move before a Fed decision is even announced, as they did heading into September’s meeting, and why a Fed rate cut doesn’t automatically bring mortgage rates down by the same amount, or on the same day. The relationship is directional, not mechanical.
Notably, mortgage rates actually dipped slightly, and then drifted in both directions, in the days immediately following the Fed’s hike, according to multiple daily rate surveys. That’s not unusual: once a rate move is widely expected, markets often price it in ahead of time, meaning the announcement itself can be almost anticlimactic for mortgage pricing specifically, even though it’s a significant event for the broader economy.
“Why Diesel Prices Are Rising — and Trump Blames Ukraine” — deeper background on the energy shock contributing to this year’s inflation and rate pressure.
What Analysts Are Saying, and Where They Disagree
Not every housing economist sees the current environment the same way. Zillow chief economist Mischa Fisher described the Fed’s move as “the medicine the housing market needs to recover,” suggesting that a Fed willing to act decisively against inflation could ultimately shorten the path to lower rates rather than prolong it.
Other market analysts have offered a more cautious near-term outlook, noting that the Fed’s own projections show its policymakers expect the federal funds rate to reach a median of roughly 4.1% by year-end, implying room for at least one additional rate increase in 2026. Under that scenario, several rate forecasters have said mortgage rates are more likely to hold near or above 7% through the fall and winter than to fall meaningfully, unless inflation data improves faster than currently expected. It’s worth being clear that both of these are forecasts and professional judgments, not certainties, and reasonable analysts currently disagree on how quickly relief might arrive.
What This Means for American Homebuyers and Homeowners
The most direct effect shows up in monthly payments. On a $400,000 mortgage, the difference between a 5.75% rate and a 7% rate works out to roughly $310 more per month, and over $111,000 more in total interest paid across a 30-year loan term, using standard amortization math. For a household earning the median income, that payment difference can be the gap between qualifying for a desired home and needing to look at a smaller one, or waiting.
- Prospective buyers face meaningfully reduced purchasing power compared with earlier this year; the same monthly budget now qualifies for a smaller loan amount than it did when rates were closer to 5.75%.
- Current homeowners with low-rate mortgages have even less incentive to sell and buy again, since doing so would mean trading a mortgage in the 3% to 5% range for one near 7%, a dynamic that continues to constrain the supply of homes available for sale. This “lock-in effect” has been a persistent feature of the housing market for several years now, and today’s rate environment reinforces rather than resolves it.
- Homeowners considering refinancing face a narrower case for doing so unless their existing rate is well above today’s average, since closing costs need to be weighed against a smaller potential rate improvement than existed when rates were lower earlier in the year.
- Renters are indirectly affected as well, since reduced home-buying activity can keep more households in the rental market longer, adding modest upward pressure to rental demand in some areas, though this effect is less immediate and harder to measure precisely than the direct impact on buyers.
- Small businesses and construction-linked employers tied to home sales, including real estate agents, mortgage brokers, home improvement retailers and contractors, tend to see reduced activity when mortgage rates rise and existing-home sales volume falls, since fewer transactions mean less associated spending on moving, renovations and furnishings.
None of this means a housing market collapse or an imminent crisis; it means higher, more expensive borrowing conditions that are already showing up in reduced affordability and transaction volume, based on the rate and payment math above.
“US Debt Has Passed $40 Trillion: How Close Is America to a Debt Crisis?” — related context on the broader Treasury market forces influencing borrowing costs economy-wide.
What to Watch Next
- The Federal Reserve’s remaining 2026 meetings, given that its own projections leave room for another rate increase before year-end.
- Monthly CPI reports from the Bureau of Labor Statistics, since inflation’s trajectory is the single biggest factor shaping where both Fed policy and mortgage rates go from here.
- The 10-year Treasury yield, the most direct market indicator mortgage rates track day to day.
- Developments in the Iran conflict and Strait of Hormuz shipping, given oil prices’ direct role in this year’s inflation and rate pressures.
- Weekly mortgage rate surveys from Freddie Mac and daily data from lenders like Zillow, since the two can diverge by several tenths of a percentage point depending on methodology and timing.
- Existing-home sales and mortgage application data, which will show whether buyers are adjusting to the new rate environment or continuing to pull back.
Mortgage rates are high in 2026 because of a specific, traceable combination of persistent inflation, an oil price shock tied to the conflict involving Iran, and a bond market that pushed yields higher well before the Federal Reserve’s own rate hike confirmed the trend. The Fed doesn’t set mortgage rates directly, but its policy decisions, and more importantly, what investors expect those decisions to be, flow through to the mortgage market via Treasury yields and mortgage-backed securities pricing.
What’s clear from the data: the roughly two-percentage-point rise in mortgage rates since early March has meaningfully reduced buying power and continues to discourage current low-rate homeowners from selling. What remains genuinely uncertain is how quickly inflation cools and whether the Fed’s own projected additional rate increase this year materializes, both of which will determine whether mortgage rates ease from current levels or stay elevated well into 2027. For now, the most useful takeaway is that today’s rate environment reflects a specific, identifiable set of economic forces rather than any single decision, and those forces are still very much in motion.
Source Links :
- Source: Freddie Mac — Primary Mortgage Market Survey. Link: https://www.freddiemac.com/pmms
- Source: Federal Reserve — September 2026 FOMC Statement and Summary of Economic Projections. Link: https://www.federalreserve.gov/monetarypolicy/fomccalendars.htm
- Source: U.S. Bureau of Labor Statistics — Consumer Price Index News Release. Link: https://www.bls.gov/news.release/cpi.htm
- Source: U.S. Department of the Treasury — Daily Treasury Par Yield Curve Rates. Link: https://home.treasury.gov/resource-center/data-chart-center/interest-rates
- Source: Zillow — Daily Mortgage Rate Data. Link: https://www.zillow.com/mortgage-rates/