Your bank statement says your savings account earned interest this year. Your grocery bill says something different. Both can be true at once, and understanding why is the key to knowing whether your savings are actually growing or quietly shrinking.
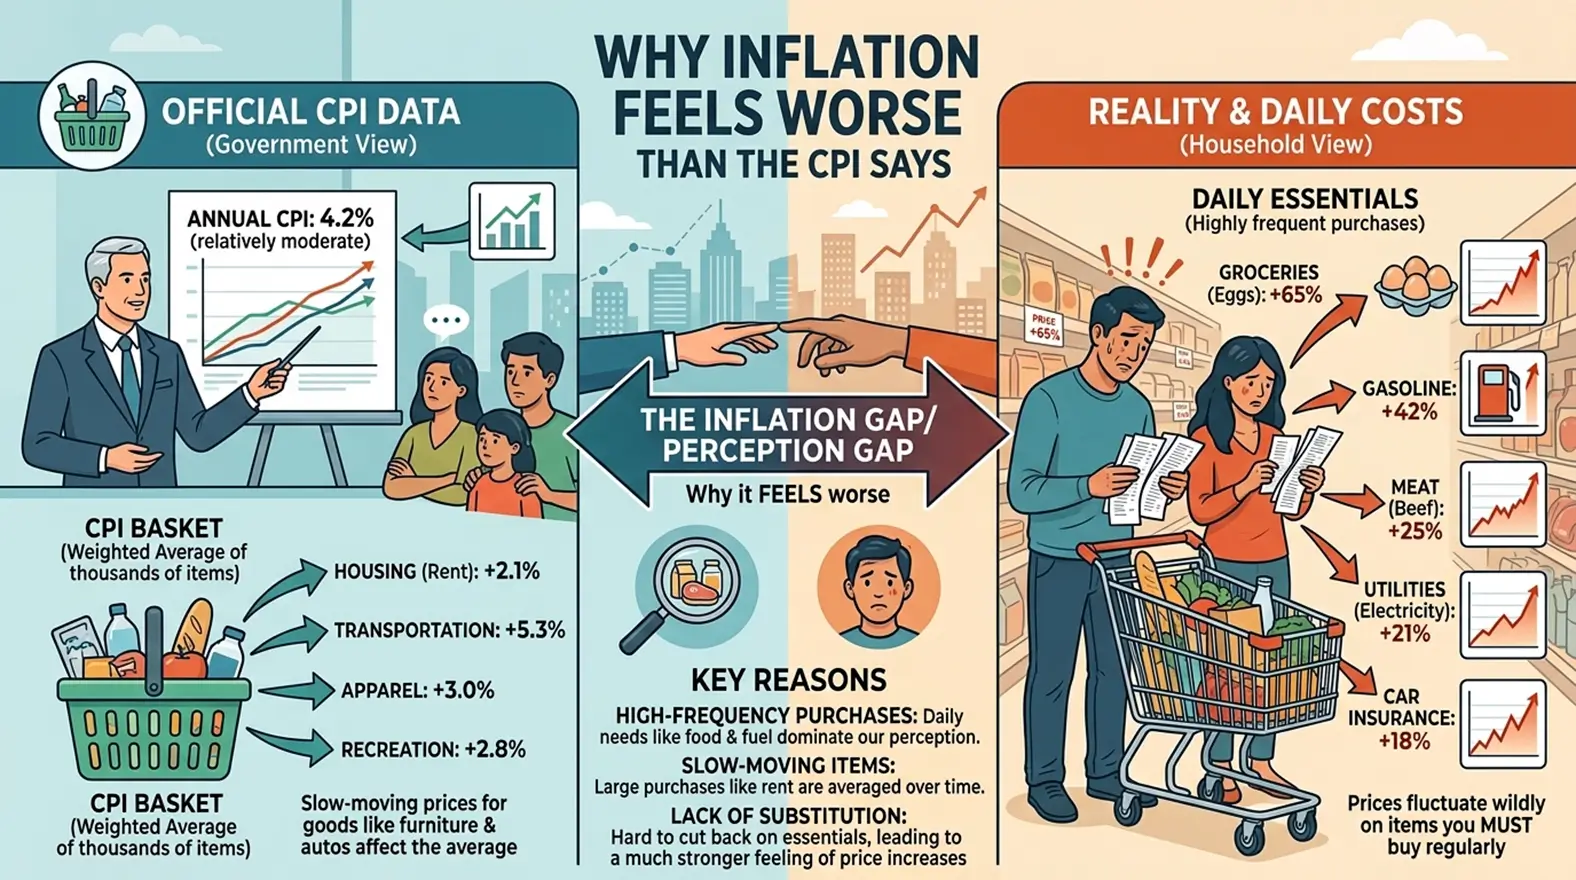
The average American savings account pays 0.38% annual interest, according to the FDIC’s most recent survey. Inflation, meanwhile, has been running well above 3% for most of 2026. That gap between what your money earns and what prices are doing is the entire story of how inflation affects your savings, and it just became more relevant: the Federal Reserve raised interest rates on September 16, 2026, for the first time since 2023, specifically because inflation hasn’t come down as expected.
The Big Picture
A savings account can pay you interest and still leave you poorer in real terms if inflation rises faster than that interest rate. The dollar amount in your account goes up. What that money can actually buy can go down at the same time. That distinction, between the number on your statement and what it’s worth, is what separates savers who are treading water from savers who are falling behind without realizing it.
“How the Federal Reserve Works” — background on how rate decisions are made and why they matter beyond savings accounts.
What’s Happening Right Now
Inflation has stayed persistently above the Federal Reserve’s 2% target through most of 2026, driven in large part by rising energy prices tied to the ongoing conflict involving Iran and disruptions in the Strait of Hormuz, along with the effects of tariffs on imported goods. Consumer price growth has ranged roughly between 3.4% and just above 4% over recent months, depending on the specific month and measure used.
That backdrop led the Federal Reserve to raise its benchmark interest rate by a quarter percentage point on September 16, bringing the target range to 3.75%–4%, its first rate hike in more than three years. Fed Chair Kevin Warsh, who took over the role in May, told reporters that “inflation remains elevated” and that price stability requires the Fed to be confident inflation is “moving to our objective clearly and at sufficient speed.” The vote was unanimous, and the Fed’s own projections show most officials expect at least one more rate increase before year-end.
That’s a meaningful shift. For most of 2026, the Fed had held rates steady, and many savers had expected cuts, which typically push savings and CD rates lower. A hike works in the opposite direction over time, though banks rarely adjust savings rates as quickly or as fully as they adjust rates on loans and credit cards.
How Inflation Actually Erodes Your Savings
The mechanism is simpler than it sounds once you separate two different numbers: your nominal return and your real return.
Nominal return is the interest rate printed on your account, the number your bank advertises.
Real return is that interest rate minus the inflation rate, and it’s the number that actually tells you whether your purchasing power grew or shrank.
Here’s the math in practice. If a savings account pays 0.38% annual interest and inflation is running at 3.5%, the real return is roughly negative 3.1%. A saver with $10,000 in that account would see their balance grow to about $10,038 after a year, an increase of $38. But if prices across the economy rose 3.5% over that same period, the goods and services that $10,038 can buy are worth less than what $10,000 could buy a year earlier. The account grew in dollar terms and shrank in purchasing power terms simultaneously.
This is why inflation is sometimes described as a hidden tax on cash: it doesn’t take money out of your account directly, but it reduces what that money is worth every year it sits earning less than the inflation rate.
“What Is Inflation?” — for readers who want the underlying definition and measurement behind CPI.
Why Not All Savings Accounts Are Affected Equally
The 0.38% figure is a national average, and it’s pulled down significantly by large traditional banks, several of which pay as little as 0.01% on standard savings accounts, according to FDIC data. That average doesn’t reflect what’s actually available to savers willing to shop around.
High-yield savings accounts, typically offered by online banks with lower overhead costs, have been paying considerably more. As of September 2026, top high-yield accounts were offering annual percentage yields as high as 4.1% to 4.21%, according to rate surveys from Bankrate and NerdWallet. One-year certificates of deposit have offered similarly competitive rates, with some surveys showing average yields above 2.5% on larger deposits, according to data from financial industry research firm Curinos.
Run the same math on a high-yield account: at 4.1% interest against inflation of roughly 3.5%, the real return turns modestly positive, around half a percentage point. That’s not a dramatic gain, but it’s the difference between losing purchasing power and preserving it. The account type you choose, not just the fact that you have savings at all, materially changes whether inflation is winning or losing against your money.
“US Debt Has Passed $40 Trillion: How Close Is America to a Debt Crisis?” — background on the broader fiscal and interest-rate environment shaping Fed policy.
A Concrete Example: $10,000 Over One Year
Putting real numbers side by side makes the gap easier to see. Assume inflation runs at 3.5% for the year, roughly in line with recent readings.
- Traditional bank savings account (0.38% APY): $10,000 grows to $10,038. Adjusted for inflation, that balance is worth approximately $9,698 in today’s purchasing power, a real loss of about $302.
- Large-bank savings account (0.01% APY): $10,000 grows to $10,001. Adjusted for inflation, that’s worth approximately $9,663 in today’s purchasing power, a real loss of about $337.
- High-yield savings account (4.10% APY): $10,000 grows to $10,410. Adjusted for inflation, that’s worth approximately $10,058 in today’s purchasing power, a real gain of about $58.
- One-year CD (2.53% average, per Curinos data): $10,000 grows to $10,253. Adjusted for inflation, that’s worth approximately $9,906 in today’s purchasing power, a real loss of about $94, smaller than a traditional savings account but still negative.
The spread between the worst and best outcome here, roughly $395 on a single $10,000 balance over just one year, is entirely a function of which account the money sits in, not how much was saved. That gap widens every year the pattern continues, and compounds for savers with larger balances or longer time horizons.
Why the Fed’s Rate Decisions Matter Here
Savings account rates generally move in the same direction as the Fed’s benchmark rate, though banks are typically slower to raise savings yields than they are to raise rates on credit cards, auto loans and mortgages, a pattern regulators and consumer advocates have long noted.
The chain works roughly like this: the Fed adjusts the federal funds rate, the rate banks charge each other for short-term overnight borrowing. That shift changes banks’ own cost of funding, since it affects what banks pay to borrow money from each other or hold as reserves. Banks competing for deposits, especially online banks with high-yield accounts and thinner branch networks to fund, tend to adjust the interest they pay savers relatively quickly to stay competitive for new deposits. Large traditional banks, which already hold enormous, relatively stable deposit bases from customers unlikely to switch banks over a fraction of a percentage point, often lag well behind or barely move their advertised savings rates at all, a gap that shows up clearly in the difference between the 0.38% national average and the 4%-plus rates available elsewhere.
Because the Fed just raised rates rather than cutting them, savers may see modestly higher yields on new savings products and CDs in the months ahead, particularly at online banks that compete aggressively on rate. But if inflation itself doesn’t cool at the same pace the Fed intends, the real return gap savers are trying to close may not close quickly, since both sides of the equation, the interest rate and the inflation rate, are moving at the same time, sometimes in ways that partially offset each other.
What This Means for American Households
For a household keeping an emergency fund or short-term savings in a traditional bank account, the practical effect of the current environment is straightforward: that cash has likely been losing purchasing power for much of 2026, even while technically “earning interest.”
- Emergency funds sitting in low-yield accounts are a common blind spot; most financial guidance recommends keeping three to six months of expenses in cash for genuine liquidity needs, but the specific type of account matters far more during high-inflation periods than during low-inflation ones.
- Longer-term savings goals, like a house down payment several years out, face a similar erosion risk if parked entirely in low-yield accounts, though savers weighing higher-yield alternatives also need to consider that some options carry more risk or less liquidity than a basic savings account.
- Fixed-income retirees living partly off interest income are affected differently than working-age savers, since they may be drawing down principal at the same time inflation reduces what that principal is worth, a combination that compounds the pressure described above.
- Borrowers, somewhat counterintuitively, aren’t entirely on the losing side of this dynamic; inflation also reduces the real burden of existing fixed-rate debt over time, though this is a separate effect from what happens to savings specifically.
None of this means moving money out of savings accounts entirely is automatically the right move for every household; savings accounts remain FDIC-insured up to $250,000 and offer immediate liquidity that other assets don’t. The relevant question isn’t whether to save, but which type of account and rate environment your savings sit in.
What to Watch Next
- The Fed’s remaining 2026 meetings, since officials have signaled at least one more possible rate increase this year, which would affect savings and CD rates going forward.
- Monthly Consumer Price Index (CPI) reports from the Bureau of Labor Statistics, the most direct measure of whether inflation is easing or staying elevated.
- High-yield savings and CD rate surveys from sources like Bankrate, NerdWallet and the FDIC’s National Rates report, to see whether banks pass along the Fed’s rate hike to savers.
- Real wage growth data from the Bureau of Labor Statistics, since wages losing ground to inflation compounds the pressure described here beyond savings accounts alone.
The Bottom Line
Inflation doesn’t need to spike dramatically to affect your savings; it simply needs to run higher than the interest rate on your account, which has been the case for most savers throughout 2026. What’s clear from the data: the national average savings rate remains far below recent inflation readings, while the best available high-yield accounts have come close to, or modestly exceeded, inflation, making the specific account a household chooses meaningfully consequential in a way it wasn’t during the near-zero-inflation years of the previous decade.
What remains uncertain is how quickly inflation cools and how much further the Fed raises rates this year, both of which will determine whether the gap between savings yields and inflation narrows or widens from here. For now, the most concrete, verifiable takeaway is this: a savings account earning less than the current inflation rate is losing purchasing power in real terms, regardless of what the balance shows, and that gap is worth checking against your own account’s actual rate rather than assuming it.
Sources :
- Source: Federal Deposit Insurance Corporation (FDIC) — National Rates and Rate Caps
- Link: https://www.fdic.gov/resources/bankers/national-rates/
- Source: U.S. Bureau of Labor Statistics — Consumer Price Index
- Link: https://www.bls.gov/cpi/
- Source: Federal Reserve — Federal Open Market Committee press releases and press conference transcripts
- Link: https://www.federalreserve.gov/monetarypolicy/fomccalendars.htm
- Source: U.S. Bureau of Economic Analysis — Personal Saving Rate
- Link: https://www.bea.gov/data/income-saving/personal-saving-rate
- Source: Bankrate — Average Savings Account Interest Rate Survey
- Link: https://www.bankrate.com/banking/savings/average-savings-interest-rates/