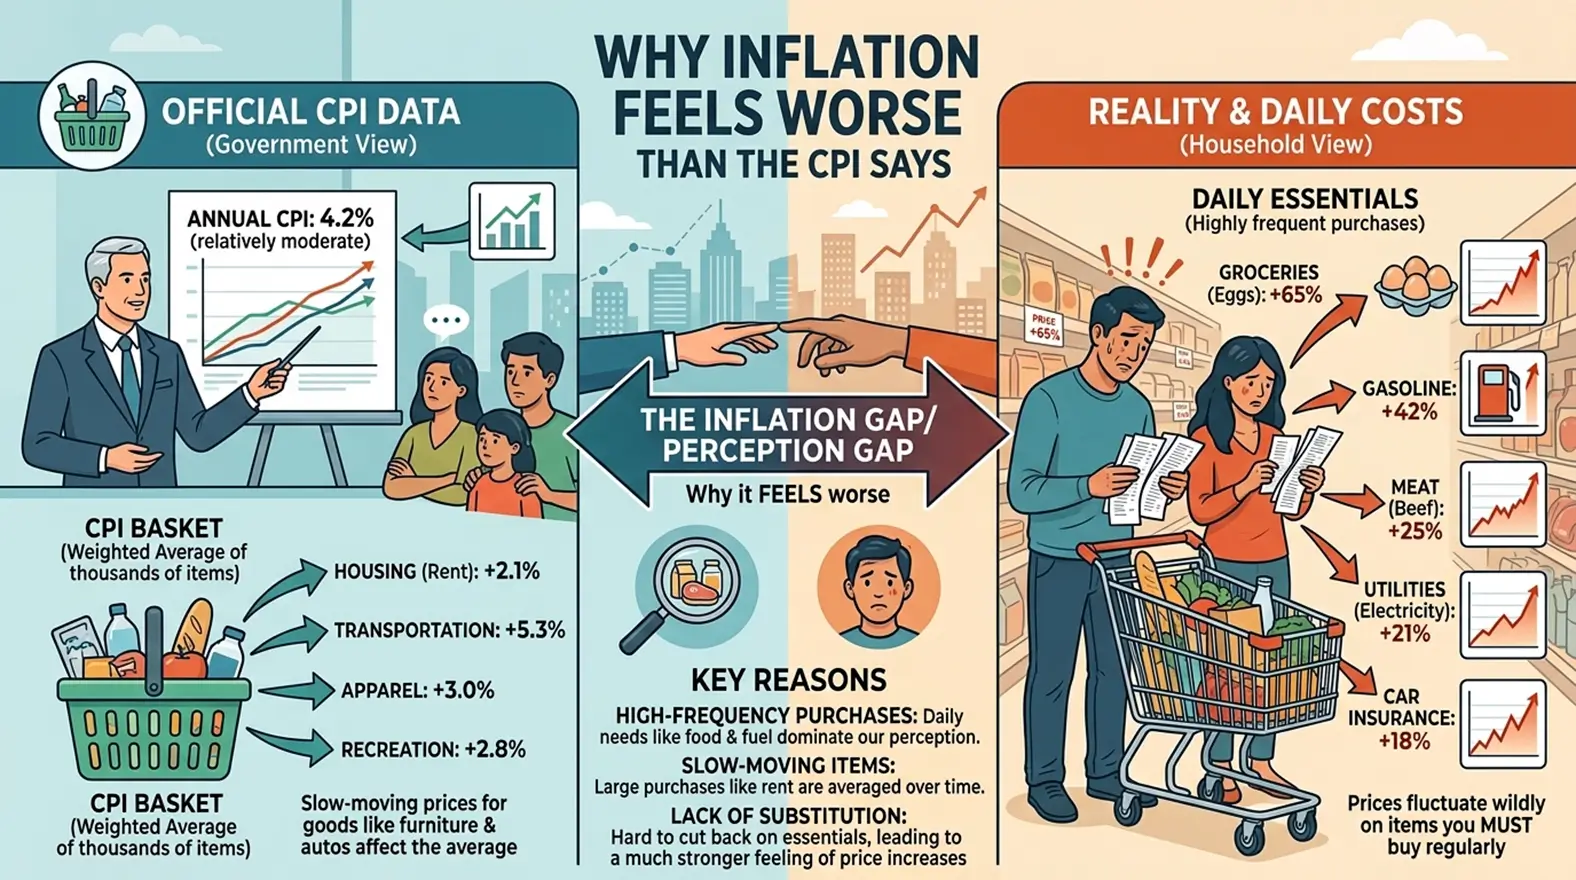
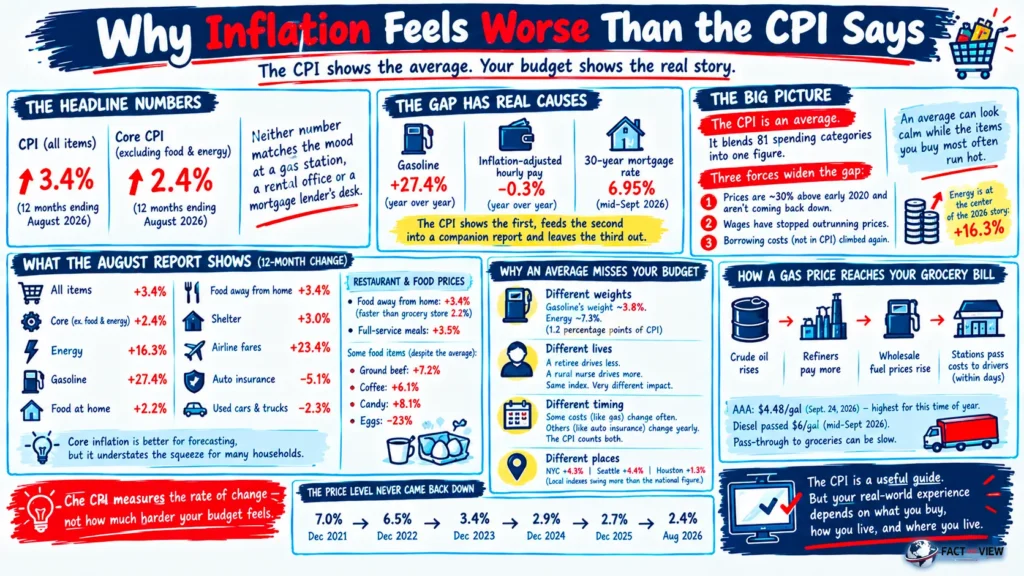
The Consumer Price Index rose 3.4% over the 12 months ending in August, the Bureau of Labor Statistics reported on Sept. 11. Remove food and energy and the figure falls to 2.4%. Neither number matches the mood at a gas station, a rental office or a mortgage lender’s desk.
The gap has measurable causes. Gasoline climbed 27.4% over the year. Inflation-adjusted hourly pay slipped 0.3%. The 30-year mortgage rate reached 6.95% in mid-September. The CPI counts the first, feeds the second into a companion report and leaves the third out of its basket.
The index itself is not broken. It answers a narrow question: how much more does a typical basket of goods and services cost than a year ago? Your household answers a different one: how much harder is the monthly budget to balance?
The Big Picture
The CPI is an average. It blends 81 spending categories into one figure, and an average can look calm while the items you buy most often run hot.
Three forces widen the gap between the headline and the household. Prices sit about 30% above their early-2020 level, and a slower pace of increase does not bring them back down. Wages have stopped outrunning prices. Borrowing costs, which the CPI does not measure, climbed again in September.
Energy sits at the center of the 2026 story. It rose 16.3% over the year, and the pump price is the one number most Americans see on every drive.
What the August Report Shows
The BLS release splits between the items that dominate headlines and the items that dominate budgets. Twelve-month changes through August:
- All items: +3.4%
- All items less food and energy (“core”): +2.4%
- Energy: +16.3%
- Gasoline: +27.4%
- Food at home: +2.2%
- Food away from home: +3.4%
- Shelter: +3.0%
- Airline fares: +23.4%
- Motor vehicle insurance: −5.1%
- Used cars and trucks: −2.3%
Core inflation strips out food and energy to show the underlying trend. Economists favor it for forecasting because gas and egg prices swing for reasons unrelated to broad demand. A household that drives to work cannot skip gasoline, so the core figure understates the squeeze for that household.
Restaurant prices deserve a note. Food away from home rose 3.4% over the year, faster than the 2.2% at the grocery store, and full-service meals rose 3.5%. Dining out is optional, so households can trim it. Cooking at home brings its own sore spots: ground beef rose 7.2%, coffee 6.1% and candy 8.1%, even as egg prices fell.
On a monthly basis, the index rose 0.4% in August after seasonal adjustment. Gasoline accounted for more than a third of that gain.
Why an Average Misses Your Budget
The CPI weights each category by how much the typical urban household spends on it. Gasoline carries a weight near 3.8% of the basket, and energy as a whole about 7.3%. Multiply energy’s weight by its 16.3% jump and the product comes to about 1.2 percentage points of the 3.4% headline, by a FACT AND VIEW estimate from the BLS weights.
Averages hide variation. A retiree who rarely drives spends little on gas. A rural nurse with a 45-minute commute spends a lot. The CPI describes neither of them.
Purchase frequency shapes memory. Drivers buy gas every week at a station that posts the price in large numbers. Auto insurance renews once or twice a year. The index counts both. The August report shows auto insurance down 5.1% from a year earlier and health insurance down 8.5%, declines that hold down the average and go unnoticed by anyone skimming a renewal notice.
Falling prices spread unevenly, too. Smartphones fell 12.2% and eggs fell 23% over the year. A household that buys neither gets no relief from the average.
Geography adds another layer. Prices in the New York area rose 4.3% and in Seattle 4.4%, while Houston’s rose 1.3%. BLS cautions that local indexes rest on smaller samples and swing more than the national figure, so treat the spread as a rough guide.
How a Gas Price Reaches the Grocery Bill
Crude oil moves first. Refiners buy crude and turn it into gasoline and diesel, so a jump in crude raises their costs, and wholesale fuel prices follow. Stations pass those costs to drivers within days.
AAA put the national average at $4.48 on Sept. 24, the highest on record for that time of year. The group cited volatility around the Strait of Hormuz and high crude costs. September’s average of $4.30 topped the previous September record of $3.83, set in 2023.
Diesel follows the same path with more force. Weekly federal data showed the national diesel average passing $6 per gallon for the first time in mid-September. Truckers burn diesel, and carriers can add fuel surcharges that raise the delivery cost of groceries, clothing and building materials.
These second-round effects arrive slowly, so the August CPI may capture only part of them. Food at home was unchanged in August, which suggests the pass-through has not shown up at the grocery store. The pass-through depends on how long crude prices stay high.
The Price Level Never Came Back Down
The CPI measures the rate of change. Year-over-year inflation read 7.0% in December 2021, 6.5% in December 2022, 3.4% in December 2023 and 2.9% in December 2024. Each reading adds to an already-higher base.
The index stood at 334.98 in August, against about 258.7 in February 2020. A basket that cost $100 then costs about $130 now, by a FACT AND VIEW calculation from BLS index levels.
Disinflation means prices climb more slowly. Deflation means prices fall. The economy has had the first, and outside a few items such as used cars, it has not had the second.
Paychecks offer little cushion. BLS reports that real average hourly earnings fell 0.3% from August 2025 to August 2026. For production and nonsupervisory workers, the decline was 0.1%. Wages have kept pace with prices at best, which leaves a household without room to absorb a gas shock.
What the CPI Leaves Out
The CPI tracks prices of goods and services that households consume. Interest on a mortgage or a credit card is the price of borrowing money, and BLS leaves it out.
Borrowing costs rose in September. On Sept. 16 the Federal Open Market Committee voted 12-0 to raise the federal funds target range by a quarter point to 3.75%-4.00%, the first increase since July 2023. The federal funds rate sets what banks charge each other overnight. Lenders build their own rates on top of it, and variable-rate credit cards tend to follow within a billing cycle or two.
Mortgages work differently. Their rates track longer-term Treasury yields, which respond to inflation expectations as well as Fed policy. Freddie Mac’s survey showed the 30-year fixed rate at 6.71% on Sept. 3, against 6.50% a year earlier. The Washington Post reported it at 6.95% on Sept. 17.
An illustrative case shows the stakes. On a $350,000 loan, the difference between 6.50% and 6.95% adds about $105 a month in principal and interest.
The CPI also treats homeowners as renters of their own homes. Its “owners’ equivalent rent” measure rose 3.1% over the year, and rent of primary residence rose 2.7%. Neither series records purchase prices or mortgage payments. A family that bought in September faces a monthly bill that no CPI line captures.
Where the CPI Draws Criticism
Critics raise two further points. The first concerns substitution. When beef gets expensive, shoppers buy chicken, and a fixed-basket index adjusts slowly to that choice. Beef and veal rose 5.9% over the year while chicken fell 2.3%, so the choice is real. BLS publishes a chained index, the C-CPI-U, built to capture it. That index rose 3.3%, a tenth of a point below the standard CPI-U. Substitution does not explain the gap between the headline and the feeling.
The second concerns quality adjustment. BLS adjusts prices when a product improves, so a better phone at the same sticker price registers as a price decline. Supporters call that accurate. Critics note that a household cannot spend a quality gain at the grocery store. The debate has run for decades. Neither side disputes the direction of the 2026 data: over the past year, prices rose faster than hourly pay.
Expectations and Mood
The University of Michigan’s consumer sentiment index finished September at 48.1, near the lowest levels in its survey history. Respondents expect prices to rise 4.6% over the next year, the highest reading since June and well above the 3.4% recorded in February, before the Iran conflict began. Long-run expectations stand at 3.4%.
Those figures measure perception, which the CPI does not and cannot. They also matter for behavior. Workers who expect higher prices ask for bigger raises, and businesses that expect higher costs raise prices early. Economists debate how strongly expectations drive actual inflation, so the survey signals risk without proving an outcome.
What It Means for Americans
The effects vary by household.
- Drivers and commuters: AAA reported gas more than a dollar above its year-ago level in mid-September. That adds at least $15 to a 15-gallon fill-up.
- Renters: The national rent index rose 2.7%, but a renter signing a new lease may face a different number.
- Borrowers and homebuyers: Higher mortgage and card rates raise monthly payments in ways the CPI does not show.
- Workers: Real hourly pay sits below its level of a year ago.
- Retirees: The CPI-W, which rose 3.5%, drives the annual Social Security cost-of-living adjustment. The Social Security Administration bases that adjustment on the third-quarter average.
- Shoppers for goods: Commodities other than food and energy rose 0.7%, so most of the pressure sits in fuel and services.
Small businesses feel the squeeze from the other side. Owners who buy diesel, shipping and inventory at higher prices must decide whether to raise menu and shelf prices or accept thinner margins. Their choices will shape how much of the energy jump reaches consumers in the coming months.
Much of this impact is indirect. The size of any effect depends on how long oil stays elevated and how lenders respond to further rate moves.
What to Watch Next
- September CPI: BLS publishes it Oct. 14 at 8:30 a.m. ET.
- The Fed: The next meeting runs Oct. 27-28. September projections point to another quarter-point increase before year-end.
- Fuel prices: AAA publishes weekly gas figures, and EIA publishes weekly diesel data.
- Grocery prices: A rise in food at home would signal that fuel costs are reaching the shelf.
- Real earnings: The BLS wage report comes alongside the CPI and shows whether paychecks are gaining on prices.
The Bottom Line
The CPI reports the average change in prices for the basket it samples, and its numbers hold up under scrutiny. The sources of the gap are weights, timing and scope. Gasoline weighs more heavily on daily life than its share of the basket suggests, price levels remain far above 2020, and borrowing costs sit outside the index.
The data shows a sharp squeeze for some households and a milder one for others. A commuter in a high-cost metro area carries more of the burden than a retiree in a low-cost one. Headline inflation of 3.4% is also above the Fed’s 2% goal, so the official number itself shows pressure.
Duration remains the open question. If crude prices ease, the energy component could cool quickly. If they hold, second-round effects could reach groceries and freight. The October 14 CPI report and the next Fed decision will show which path the economy is on.
Continue reading from Fact and View:
- “Why Americans Still Feel Poor Even When Inflation Falls” for the household debt and sentiment data referenced here.
- “How Interest Rates Affect Your Everyday Life” for background on how Fed policy affects the wage-dependent households described above.
- “Why Prices Are Still Rising in 2026 Even as Inflation Cools” for related coverage of the gap between aggregate data and lived experience.
- “How Inflation Affects Your Savings” for the savings side of the divide between asset owners and everyone else.
Source:
- U.S. Bureau of Labor Statistics, Consumer Price Index news release (August 2026)
- U.S. Bureau of Labor Statistics, Real Earnings
- Federal Reserve, FOMC statement of Sept. 16, 2026
- Freddie Mac, Primary Mortgage Market Survey
- University of Michigan, Surveys of Consumers
- AAA, Gas Prices
- U.S. Energy Information Administration, Gasoline and Diesel Fuel Update