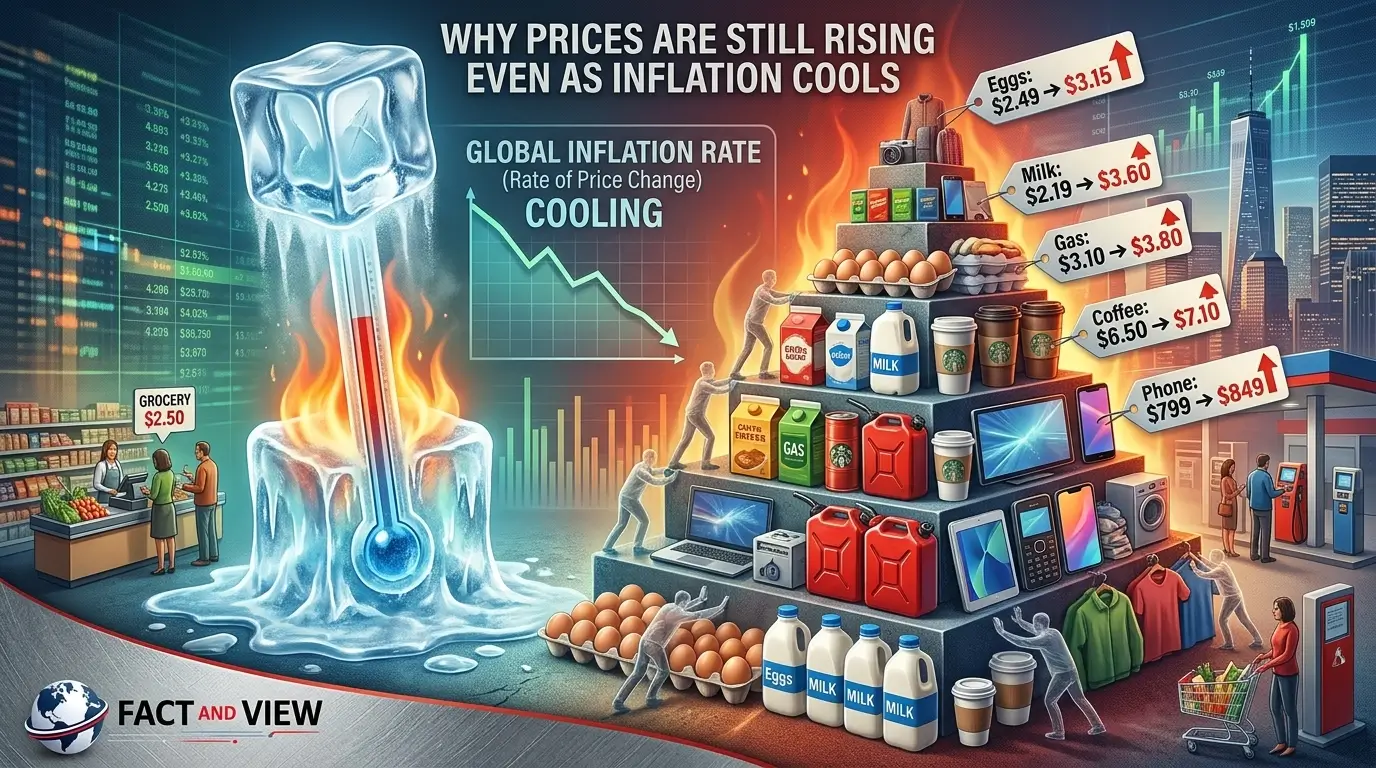
Headlines this year keep saying inflation is cooling. Grocery receipts, gas station signs and insurance renewal notices keep telling a different story. Both can be true at the same time, and the gap between them is one of the more confusing parts of the current economy to explain.
Core inflation, the measure that strips out food and energy, has genuinely eased in 2026, falling to 2.4% annually in August from a peak closer to 4% earlier in the year, according to the Bureau of Labor Statistics. At the same time, gasoline prices were up 27.4% from a year earlier, airfares were up 23.4%, and shelter costs remained roughly 3% higher year-over-year, all in the same August report. Inflation cooling in the aggregate and specific prices still climbing sharply aren’t contradictory facts. They’re two different ways of measuring the same economy, and understanding the difference explains why so many Americans feel like prices keep rising even as the news says otherwise.
The Big Picture
The headline inflation number is an average across hundreds of categories. When a handful of categories, especially energy, spike sharply, they can keep the overall number elevated even while most other prices are behaving normally. That’s largely the story of 2026: broad, underlying inflation has calmed down, but a narrower set of highly visible, frequently purchased items has not, and those are exactly the prices people notice most.
“How Inflation Affects Your Savings” — related coverage of how the current rate environment affects household cash and deposit accounts.
What the Data Actually Shows
The Consumer Price Index (CPI) rose 3.4% over the twelve months ending in August 2026, unchanged from July’s annual reading, according to the Bureau of Labor Statistics. That headline figure has come down from a three-year high near 4.2% reached earlier in the year, but it has stalled rather than continuing to fall in recent months.
Underneath that headline number, the details diverge sharply by category:
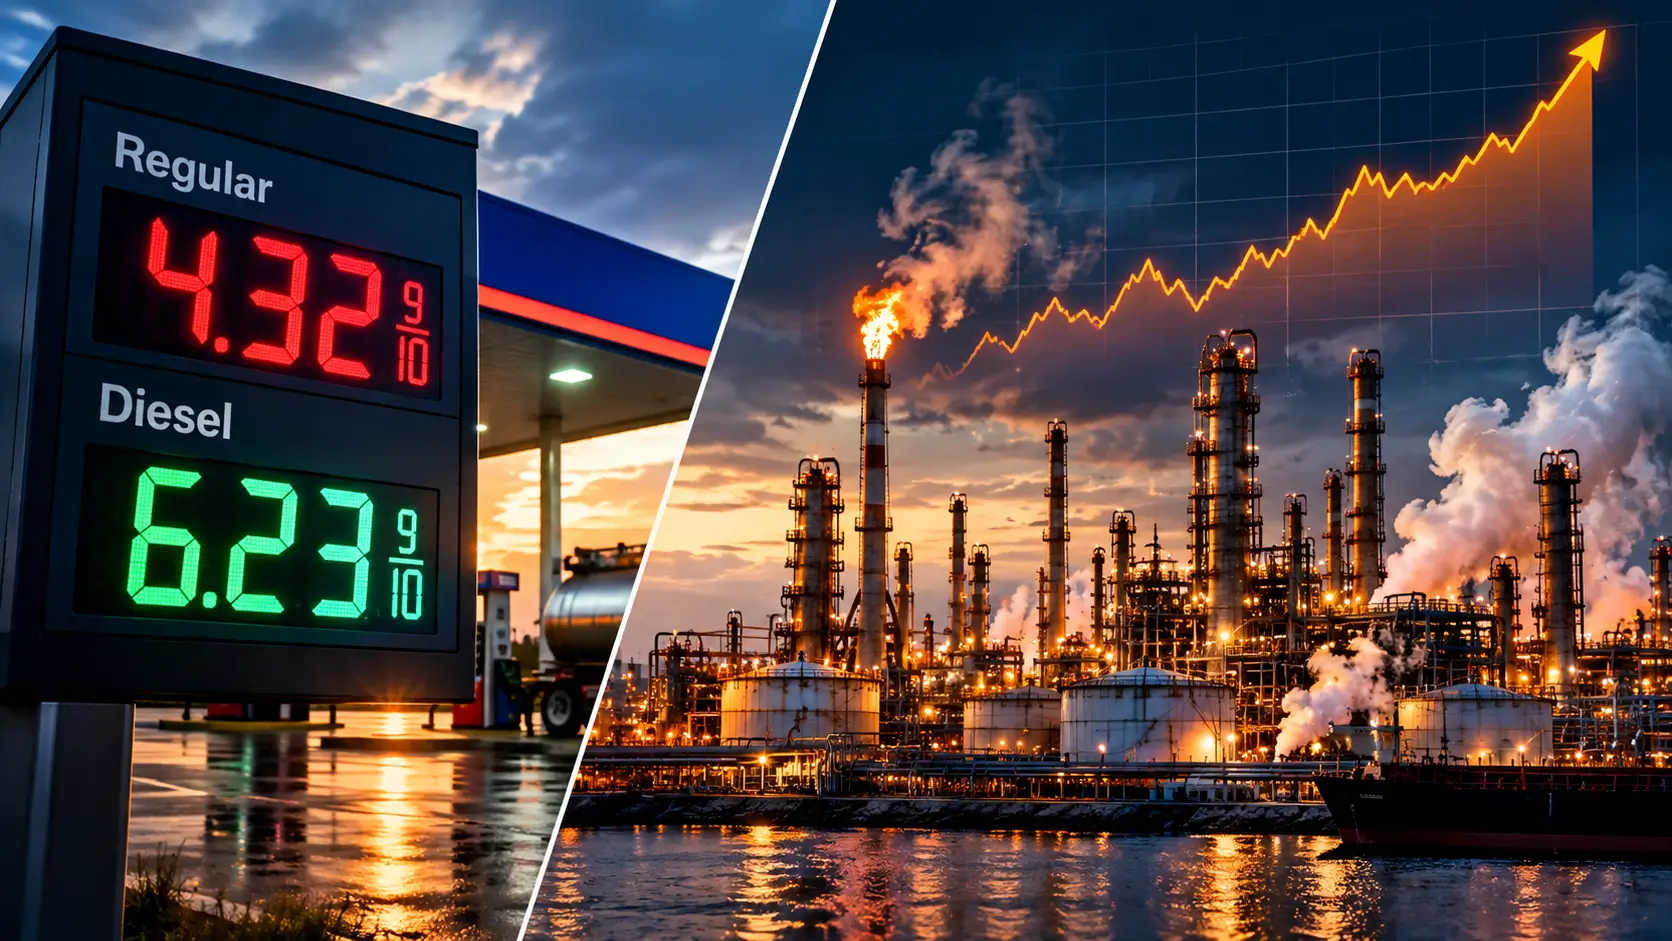
- Gasoline rose 3.9% in August alone and was up 27.4% from a year earlier, accounting for more than a third of the entire monthly increase in the CPI, according to the BLS.
- Airline fares rose 2.7% in August and 23.4% year-over-year, driven by higher jet fuel costs.
- Shelter, which makes up more than 40% of core CPI, rose 3.0% year-over-year, moderating slightly from 3.2% the prior month but still a major contributor given its weight in the index.
- Motor vehicle insurance was up 4.1% from a year earlier, even though it was flat on a monthly basis in August.
- Food away from home rose 0.3% in August, while grocery store food prices (food at home) were roughly flat month-over-month but still 2.7% higher than a year earlier, according to Bureau of Labor Statistics and USDA Economic Research Service data.
“What Is Inflation?” — background on how CPI is measured and calculated.
Core CPI, which excludes food and energy specifically because those categories are volatile, rose 0.3% in August and stood at 2.4% annually, down from 2.5% in July, according to the BLS. That’s the measure the Federal Reserve watches most closely for underlying inflation trends, and by that measure, genuine progress has been made this year.
Why Prices Are Still Rising: The Energy Shock
The single biggest reason headline inflation hasn’t fallen further is energy, and the energy story in 2026 has been unusual. Oil and gasoline prices rose sharply following the escalation of the conflict involving Iran and disruptions around the Strait of Hormuz, a key global shipping route that normally carries roughly one-fifth of the world’s oil supply, according to the U.S. Energy Information Administration. That disruption pushed crude prices higher for months, and those higher crude costs worked their way into gasoline, diesel and jet fuel prices at a pace most other categories didn’t experience.
“Why Diesel Prices Are Rising — and Trump Blames Ukraine” — deeper background on the energy market forces contributing to headline inflation.
The mechanism runs in a fairly direct line: higher crude prices raise refiners’ input costs; refiners pass a large share of that cost increase through to wholesale fuel prices, particularly when refining capacity is already stretched; wholesale prices then flow into what gas stations charge at the pump, typically within days rather than months, since gasoline is one of the most immediately repriced consumer goods in the entire economy. Airlines face a similar, if slightly slower, pass-through with jet fuel, which is part of why airfares climbed alongside gasoline.
Because energy prices carry significant weight in the overall CPI basket, and because gasoline specifically is a purchase most Americans make weekly and notice immediately, an energy-driven price spike shows up in the headline inflation number and in household budgets far more visibly than a similarly sized move in a less frequently purchased category would.
How Base Effects Change What “Cooling” Actually Means
Here’s a mechanism that trips up a lot of people trying to follow inflation data: annual inflation rates compare today’s prices to prices exactly one year ago, which means the math can shift even when nothing changes about how fast prices are currently rising.
If prices jumped sharply a year ago and then rise at a slower pace this year, the year-over-year percentage can fall, a pattern economists call a “base effect,” even though prices are still going up in absolute terms. A simplified example makes this concrete: imagine gasoline cost $3.00 a gallon two years ago, jumped to $3.90 last year (a 30% increase), and now sits at $4.10 this year. The year-over-year comparison shows “only” a 5% increase, even though the price is still climbing and remains far above where it started. Slower growth on top of an already-elevated base isn’t the same as prices coming down.
This is part of why headline CPI eased from its earlier 2026 peak without prices actually falling in any meaningful category. Falling inflation, in other words, describes the rate of increase slowing down, not prices going down. Almost nothing in the CPI report actually declined in price during August; the overall pace of increase simply moderated compared with the sharpest months earlier in the year.
“US Debt Has Passed $40 Trillion: How Close Is America to a Debt Crisis?” — related background on the broader fiscal and monetary environment shaping current price pressures.
Why Core Inflation and Headline Inflation Tell Different Stories
The Federal Reserve focuses on core inflation partly because food and energy prices are driven by global commodity markets, weather, and geopolitical events that monetary policy has little ability to influence directly. Raising or lowering interest rates doesn’t affect Iranian oil exports or Gulf shipping routes.
That’s a reasonable methodological choice for setting interest rate policy, but it creates a real disconnect for ordinary households, who don’t get to exclude gas and groceries from their own monthly budgets. When policymakers and financial media describe inflation as “cooling,” they’re often referring to core CPI’s genuine improvement. When consumers say prices don’t feel like they’re cooling, they’re usually responding to the headline number, and specifically to energy and shelter costs, the exact categories core CPI leaves out.
Fed Chair Kevin Warsh acknowledged this tension directly at his September press conference, noting that the central bank raised its benchmark interest rate to a range of 3.75%–4% in part because “inflation remains elevated” despite improvement in underlying measures, and that the Fed’s own summer inflation readings did not show underlying trends “meaningfully improved.”
What This Means for American Households
The practical impact of this divergence depends heavily on what a household actually spends money on, which is part of why inflation can feel very different from one family to the next even when they’re looking at the same national statistics.
- Drivers and commuters are experiencing the sharpest, most visible price pressure, given gasoline’s 27.4% year-over-year increase, a cost that hits lower-income and rural households disproportionately harder since they typically spend a larger share of their budget on transportation.
- Renters and homeowners continue facing meaningfully higher shelter costs than a few years ago, even though the pace of shelter inflation has been gradually moderating rather than accelerating further.
- Drivers with auto insurance are seeing renewal premiums rise well above the general inflation rate, a trend that has persisted for several years and shows limited signs of reversing based on the latest data.
- Grocery shoppers are seeing more modest month-to-month changes than the headline suggests, though prices remain elevated compared with recent years rather than returning to pre-2022 levels.
- Air travelers face costs tracking energy markets closely, given how directly jet fuel prices flow into ticket pricing.
- Borrowers and savers face a more complicated picture following the Fed’s September rate hike; higher benchmark rates generally mean higher costs on new credit card, auto and business loan borrowing, while savings and CD rates may rise modestly as well, though banks typically adjust deposit rates more slowly than borrowing rates.
None of this means the official inflation data is wrong or misleading; it means aggregate statistics necessarily smooth over the very real differences in how inflation affects a retiree living on a fixed income in a rural area versus a young renter in a city, or a household that drives 20,000 miles a year versus one that doesn’t own a car at all.
What to Watch Next
- The September CPI report, scheduled for release by the Bureau of Labor Statistics, will show whether core inflation’s improvement continues or stalls, and whether energy’s outsized contribution to headline inflation persists.
- Developments in the Iran conflict and Strait of Hormuz shipping, since continued disruption would likely keep energy prices, and therefore headline CPI, elevated regardless of progress on core measures.
- The Federal Reserve’s remaining 2026 meetings, given that officials have signaled at least one more possible rate increase this year if inflation data doesn’t show clearer improvement.
- Shelter cost trends specifically, since this category’s outsized weight in core CPI means continued moderation there would meaningfully pull the core measure down further.
- Producer Price Index (PPI) data, which often signals where consumer prices are headed before changes show up in the CPI itself.
The Bottom Line
Inflation cooling and prices still rising sharply in specific categories are not contradictory claims; they describe different layers of the same economic picture. Core inflation has genuinely improved in 2026, falling to 2.4% annually by August, while headline inflation has stalled near 3.4% largely because of an energy price shock tied to the conflict involving Iran, a factor with little connection to domestic monetary policy or the broader disinflation trend.
What’s clear from the data: households that spend heavily on gasoline, insurance, and air travel are experiencing meaningfully more inflation than the core numbers suggest, while those categories’ improvement or persistence over the coming months will likely determine whether headline inflation resumes falling or stays elevated. What remains uncertain is how long the current energy disruption continues and whether core inflation’s progress holds up as the Federal Reserve’s recent rate increase works its way through the economy. For now, the most useful takeaway for readers trying to make sense of conflicting inflation headlines is this: check which measure, core or headline, and which specific categories, are actually being discussed before assuming either “inflation is fixed” or “inflation is getting worse” tells the whole story.
Sources :
Source: U.S. Bureau of Labor Statistics — Consumer Price Index News Release, August 2026
Link: https://www.bls.gov/news.release/cpi.htm
Source: U.S. Bureau of Labor Statistics — CPI Home
Link: https://www.bls.gov/cpi/
Source: U.S. Department of Agriculture, Economic Research Service — Food Price Outlook
Link: https://www.ers.usda.gov/data-products/food-price-outlook/summary-findings
Source: Federal Reserve — September 2026 FOMC Statement and Press Conference
Link: https://www.federalreserve.gov/monetarypolicy/fomccalendars.htm
Source: National Association of Home Builders, Eye on Housing — Shelter Inflation Analysis