Americans spent 6.1% more dollars in August than they did a year earlier. That sounds like a shopping boom until you ask what the dollars bought. Prices rose 3.4% over the same period, so the real gain in goods and services was about 2.6%. At the grocery store, the picture looks different. NielsenIQ data show shoppers bought about 2% fewer items than a year earlier as of June.
So are Americans buying less, or are they paying more? Both statements hold, and the answer depends on where you look. This article separates price from quantity, shows where households are cutting back, and explains what the split means for your budget.
The Short Answer
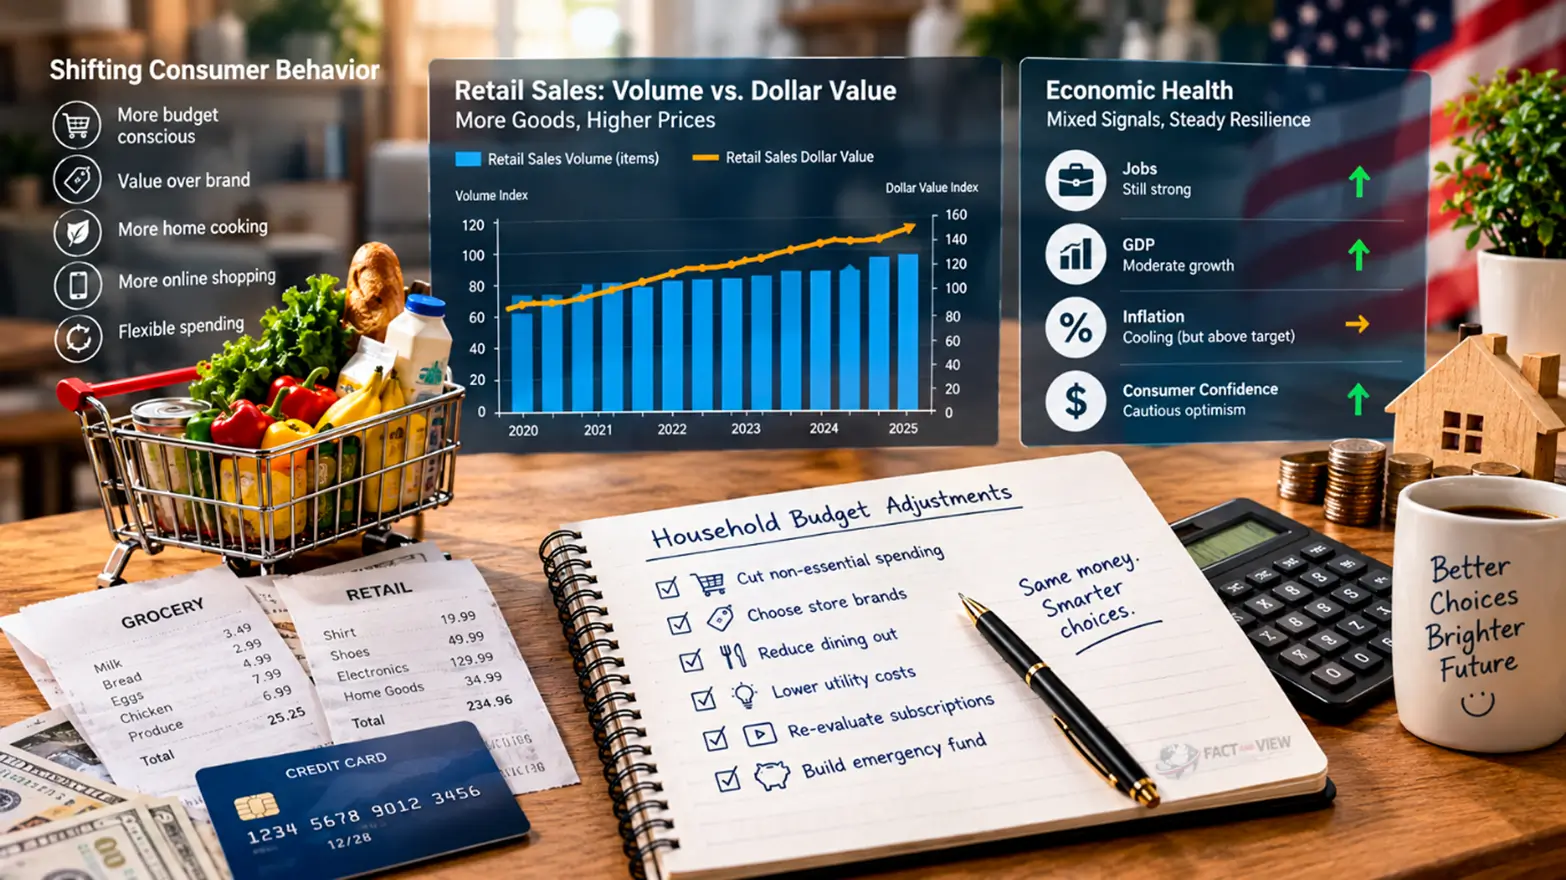
In total, Americans are buying a bit more than a year ago and paying much more for it. In staples such as groceries and gasoline, many households are buying less.
Higher prices explain more than half of the growth in dollars spent. Real purchases, which strip out inflation, have grown at a slower pace than the headline spending figures suggest. Pay has not kept pace, which is why a lighter cart can still come with a bigger receipt.
How to Tell Price From Quantity
Economists use two versions of the same number. Nominal spending counts dollars, so it rises when prices rise even if you buy the same items. Real spending adjusts for inflation and tries to measure the quantity of goods and services purchased.
The Bureau of Economic Analysis (BEA) publishes both in its monthly personal income and outlays report. The Census Bureau publishes retail sales in dollars, and the Bureau of Labor Statistics (BLS) publishes the consumer price index (CPI) that measures how fast prices change. Put those together and you can estimate what happened to quantity.
The method has limits. Retail sales and CPI categories do not cover identical baskets, so any “implied volume” figure is a rough guide. Read it as a clue.
What the Latest Numbers Show
The latest federal data point to growth in real spending and weak growth in real income.
| Measure | Change from a year earlier | Source |
|---|---|---|
| Spending in current dollars (August) | +6.1% | BEA via FRED |
| Consumer prices, PCE index (August) | +3.4% | BEA |
| Real spending (August) | +2.6% | BEA via FRED, author’s calculation |
| Real disposable income (August) | +1.3% | BEA via FRED, author’s calculation |
| Real hourly earnings (September) | -0.7% | BLS |
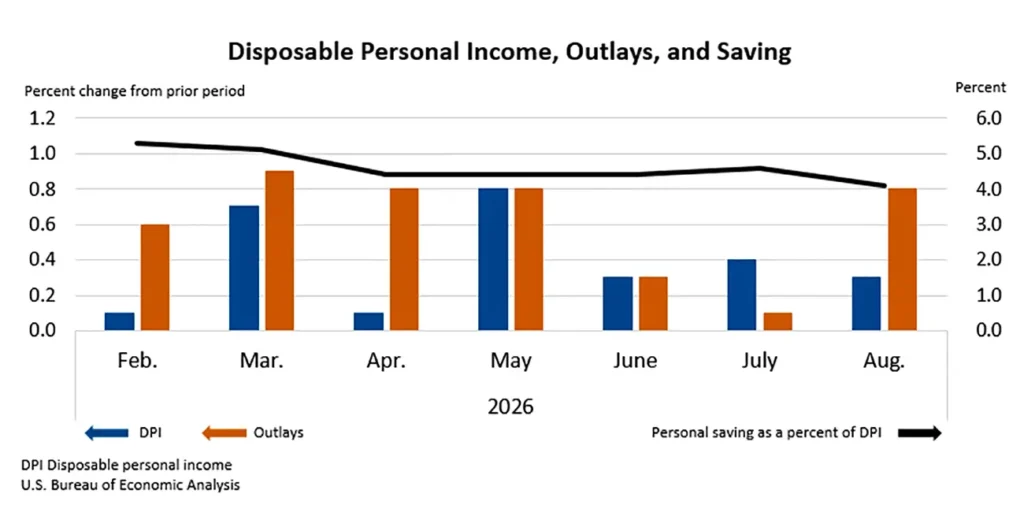
Spending grew about twice as fast as real after-tax income. Something other than income growth filled that gap, such as savings, credit, tax refunds or investment gains. These figures do not say which. The BEA put the saving rate at 4.1% of disposable income in August, which leaves a thin cushion. For more on the pay side, see how American paychecks compare with the cost of living.
The August data also showed real spending up 0.6% from July, a big monthly jump. One month can reverse, so the yearly figure is a better guide to the trend. The 2.6% annual gain in real spending is the number to use when you compare it with prices and income.
Where Americans Are Buying Less
Groceries show the clearest pullback. Bain & Company, working with NielsenIQ data, reported in July that grocery units sold fell about 2% from a year earlier in most of the four months through June. Units were down 1.8% in June. Prices over the same period rose 2% to 3% and have climbed about 33% since 2019, according to the same analysis.
Bain describes the grocery business as a share game. Discounters, dollar stores, mass retailers and warehouse clubs are gaining trips, but the unit decline reaches them too. Fewer units sold means less volume for the food companies that supply those stores.
Bain also surveyed shoppers. Some 80% of Americans said they were trying to cut spending, and 28% said they were cutting back on groceries. Among those trimming grocery bills, 56% said they were switching to lower-priced brands, 49% said they were buying fewer items, and 44% said they were leaning more on coupons and promotions.
Bain listed several causes: a drop in SNAP participation late last year, higher gas prices, slower growth in disposable income, more online ordering with smaller baskets, and the spread of GLP-1 weight-loss drugs. The firm did not rank them, so no one can say which matters most.
Federal data point the same way. Census reported that grocery store sales rose 0.9% in September from a year earlier, while the CPI for food at home rose 1.8%. If both numbers hold, grocery volume fell by about 1%. That estimate is rough, because grocery stores sell some nonfood items and the CPI covers food alone.
Gasoline shows a bigger gap. Sales at gas stations rose 28.1% in September from a year earlier, but the CPI for gasoline rose 34.2%. The gap implies about 4% to 5% less fuel sold, though gas stations also sell snacks and drinks. Why gas prices are rising so fast in 2026 explains the price side.
Where Americans Are Buying More
Not every category fits the “buying less” story. Restaurant and bar sales rose 7.0% in September from a year earlier, while the CPI for food away from home rose 3.5%. That gap points to about 3% more dining, or to customers ordering more expensive items. Census data cannot tell the two apart.
Online retailers grew 8.2% over the year, more than double the 3.7% overall CPI increase. Online shopping includes many purchases that used to happen in stores, so the shift may reflect where people shop as much as how much.
One reading of these numbers is that households protect meals out and online purchases while they cut staples and fuel. That is an interpretation, not a measured fact. Why Both Statements Can Be True
Three forces explain how spending can grow while many households cut back.
First, inflation inflates the dollar total. More than half of the 6.1% rise in spending came from higher prices, not extra purchases.
Second, mix matters. Spending on meals out, travel and online goods can rise while spending on groceries and gasoline falls. The national average hides those opposing moves.
Third, the average household is not the typical household. Higher-income households account for a large share of total consumer spending, so strong spending at the top can lift national totals while lower-income households cut back. Estimates of the top earners’ share vary by method. Our earlier piece on why Americans are spending more even when money feels tight covers that divide.
Bain’s survey adds a clue. It found that intent to spend among lower- and middle-income households sat at or below its long-term average, and that a tax refund season about $50 billion larger than last year’s helped hold up nominal spending. A one-time boost like that fades.
Why Prices Still Hurt
Inflation is below its 2022 peak, but price levels seldom reset. The CPI rose 3.7% over the year to September, and energy up 20.4% from a year earlier in September, gasoline up 34.2%, and shelter up 3.2%. Core prices, which exclude food and energy, rose 2.6%.
Households track the items they buy most often, such as gas, groceries and rent, so the overall rate can understate what they feel. That gap explains why many people feel poorer even when headline inflation falls, a topic we cover in why Americans still feel poor even when inflation falls. Our explainer on why prices are still rising in 2026 even as inflation cools covers the broader price story.
Real average hourly earnings fell 0.7% from September 2025 to September 2026, according to the BLS. A worker with a 3% raise lost ground in a year with 3.7% inflation. September’s 0.6% monthly CPI increase, driven by a 5.2% jump in energy prices, widened that gap.
What This Means for Your Budget
If your grocery bill rose while your cart got lighter, you are in a large group. Bain’s survey found shoppers adjusting in several ways: cheaper brands, fewer items and more coupons.
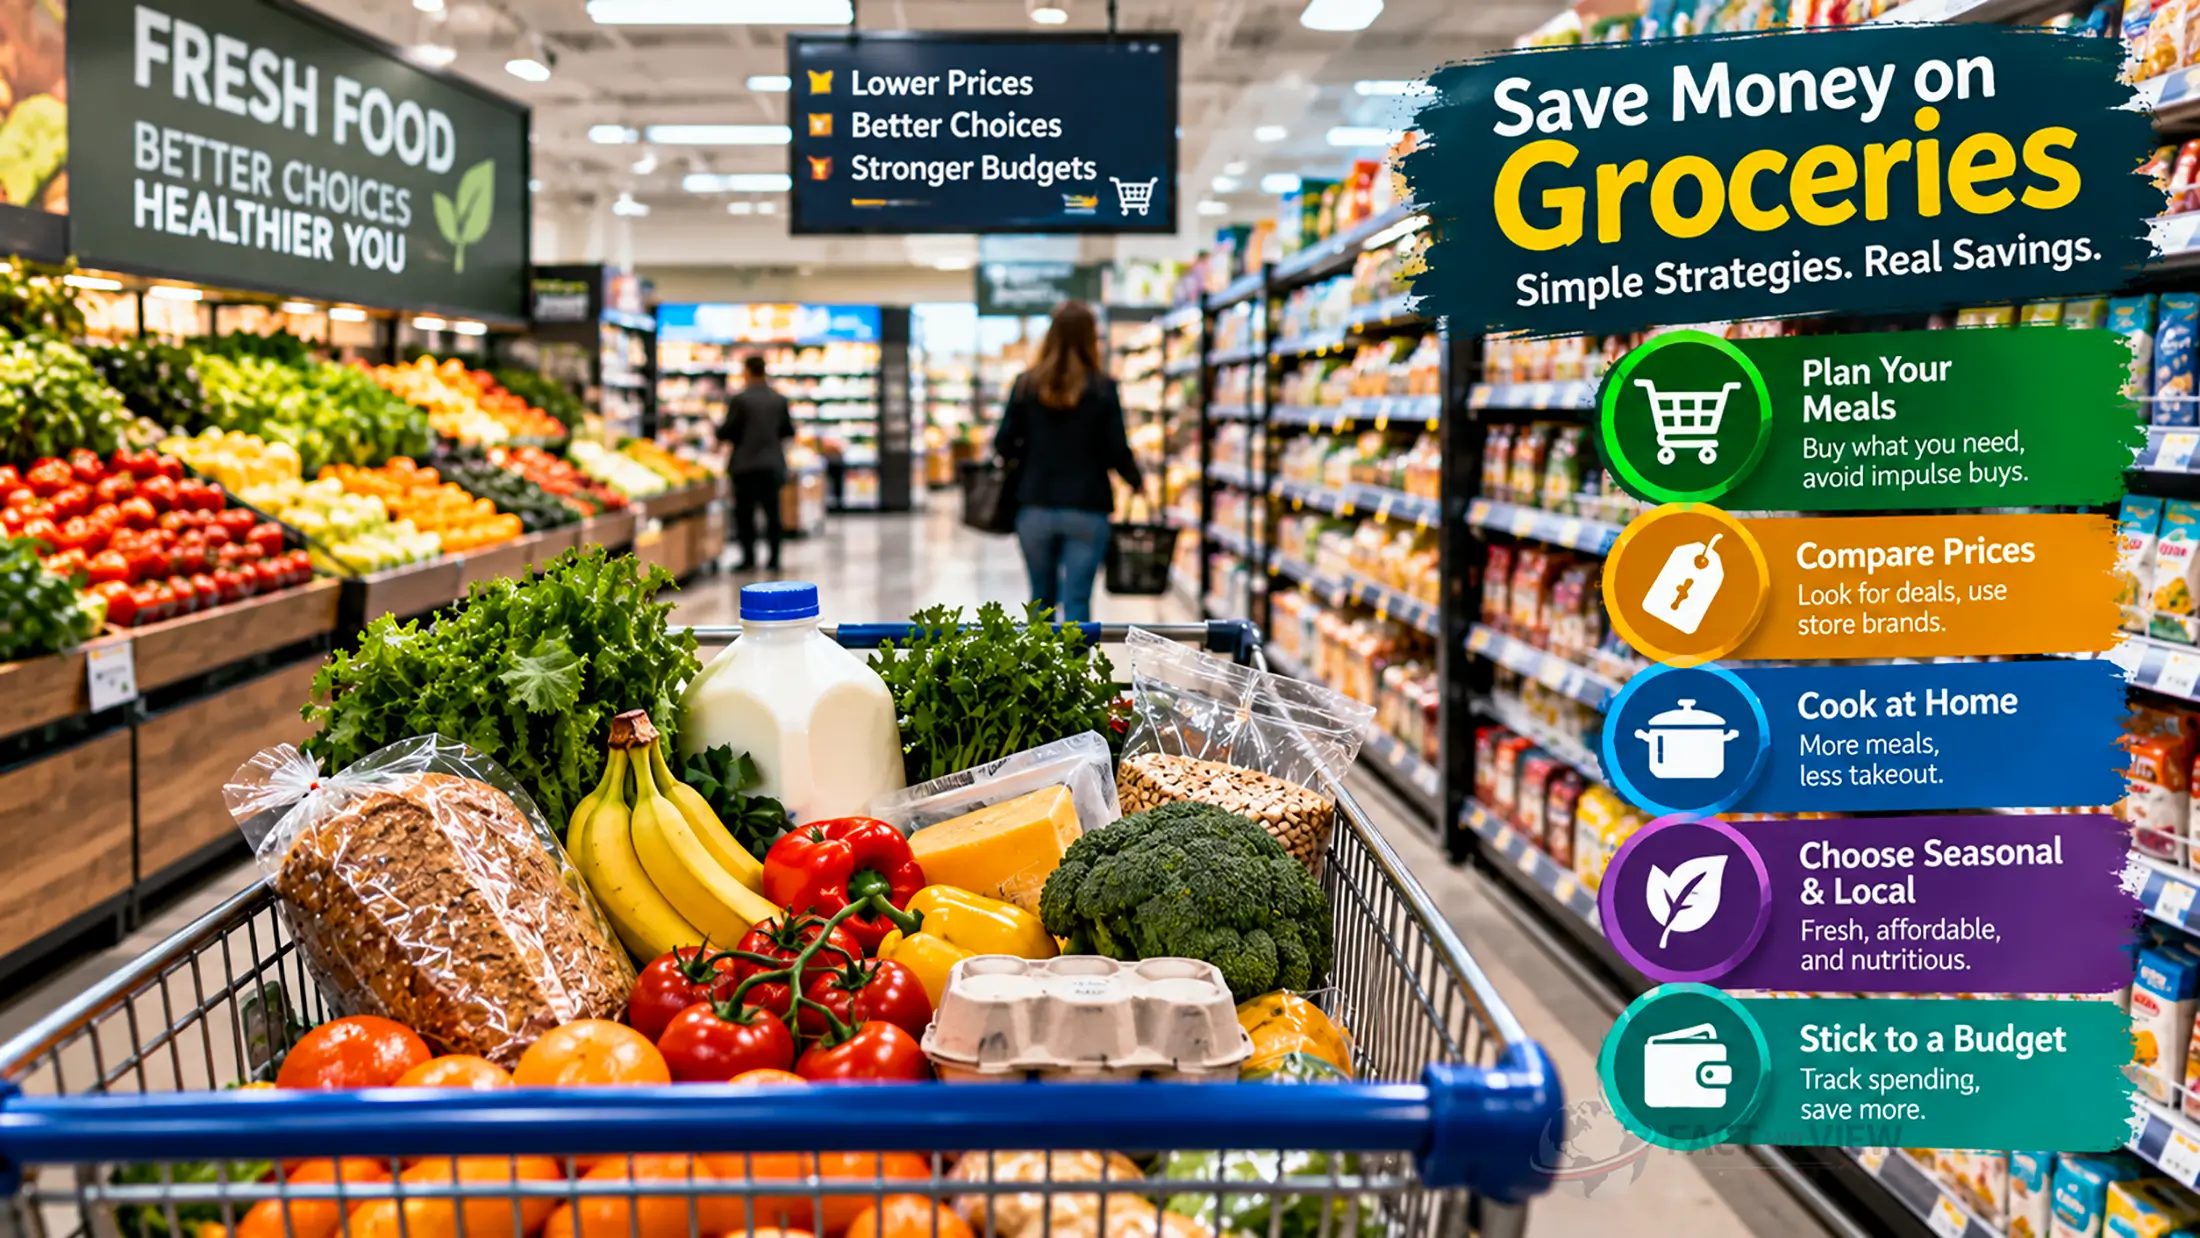
Three habits can help. Compare the unit price on the shelf tag rather than the sticker price. Test a store brand on the items you buy most. Track a month of grocery and fuel spending to see where cuts are easiest.
Our guide to saving money on groceries on a tight budget offers specific tactics. More coverage of household costs sits in our everyday costs section.
What Could Happen Next
These are scenarios, not forecasts.
Energy prices ease. If gasoline and energy costs fall, real incomes recover without a wage jump, and grocery units could stabilize. This is the most favorable path for households.
Prices stay high and pay lags. If real earnings keep falling, cutbacks that now concentrate in staples could spread to discretionary purchases. Retailers would see weaker volume even if their dollar sales hold up.
Spending drops. A saving rate of 4.1% and the fade of the tax refund boost leave little room to absorb another shock. If hiring weakens, the cushion could thin fast. The data do not show that yet.
What to Watch
- The Census retail sales report for October, scheduled for November 17.
- The BEA personal income and outlays report for September, which will show whether August’s real spending jump held.
- The October CPI, with a close look at food at home, energy and shelter.
- The BLS real earnings figure, which shows whether pay is catching up with prices.
- NielsenIQ and Bain updates on grocery units.
The Bottom Line
So are Americans buying less? In total, no. Real spending is up about 2.6% from a year ago. In groceries and fuel, yes: units are down, and shoppers report trading down and cutting items.
Rising dollars spent do not prove households are doing well, because real income is growing slower than spending and real earnings are falling. Falling grocery units do not prove a spending collapse either, since other categories are growing.
What remains uncertain is how long households can keep spending faster than their incomes grow. The tax refund boost has passed, the saving rate is thin, and energy prices have a large effect on both. Watch real earnings and grocery units. If both turn up, the squeeze is easing.
SOURCES
- Source: BEA, Personal Income and Outlays, August 2026 (released September 30, 2026). What it supports: the 3.4% PCE price increase, 0.6% real spending jump in August, the 4.1% saving rate and flat real disposable income in the month.
- Source: FRED series PCE, PCEC96 and DSPIC96 (BEA data). What it supports: the 6.1% nominal, 2.6% real spending and 1.3% real disposable income year-over-year figures, which are the author’s calculations from the published monthly values.
- Source: BLS, Consumer Price Index, September 2026 (released October 14, 2026). What it supports: 3.7% overall CPI, food at home +1.8%, food away from home +3.5%, energy +20.4%, gasoline +34.2%, shelter +3.2%, core +2.6%.
- Source: BLS, Real Earnings, September 2026. What it supports: real average hourly earnings down 0.7% over the year.
- Source: Census Bureau, Advance Monthly Retail Sales, September 2026 (released October 15, 2026). What it supports: grocery +0.9%, gas stations +28.1%, food services +7.0%, nonstore +8.2% year over year; next release November 17.
- Source: Bain & Company with NielsenIQ, US grocery slowdown release (July 16, 2026). What it supports: grocery unit declines, shopper survey results and the list of drivers.