
Inflation has cooled from its worst levels. Consumer confidence hasn’t followed. In September 2026, the University of Michigan’s consumer sentiment index sat at 47.8, near some of the lowest readings on record, even as the government’s own inflation data shows meaningful improvement in the broader trend.
That gap, between what the statistics say and what Americans report feeling, isn’t a contradiction or a data error. It’s the predictable result of several distinct economic forces that don’t show up in a single headline inflation number, and understanding them explains why “inflation is falling” and “I feel poorer than I used to” can both be true at the same time.
The Big Picture
A falling inflation rate means prices are rising more slowly than before. It does not mean prices are falling, and it says nothing about whether a household’s debt, wages, or savings have kept pace with the price increases that already happened. Consumer sentiment reflects all of that combined history, not just the most recent month’s inflation report.
“Why Prices Are Still Rising in 2026 — Even as Inflation Cools” — a closely related look at the gap between the official inflation rate and specific consumer-facing prices.
What the Data Actually Shows
The Consumer Price Index rose 3.4% over the twelve months ending in August 2026, with core inflation (excluding food and energy) down to 2.4%, according to the Bureau of Labor Statistics, a genuine improvement from earlier in the year. By that measure, the disinflation story is real.
Consumer sentiment tells a rougher story. The University of Michigan’s index fell for a second consecutive month in September, landing 16% below February 2026 levels, before the escalation of the conflict involving Iran, and 13% below where it stood a year earlier. Sentiment did briefly recover over the summer, climbing to 55.2 in July from a record low near 47 in May, before slipping again as fuel prices rose and trade tensions resurfaced. Year-ahead inflation expectations among consumers surveyed jumped to 4.6% in September, more than a full percentage point above the actual, measured inflation rate.
That last figure matters enormously: people are budgeting and making decisions based on what they expect inflation to do, not what a government report says it’s currently doing, and right now those two numbers don’t match.
Why Prices Feel High Even When Inflation “Falls”
The most important, and most commonly misunderstood, piece of this puzzle is the difference between a price level and an inflation rate.
Inflation cooling means prices are climbing less steeply than before; it does not mean prices are returning to where they started. Overall consumer prices were roughly 25% higher in late 2025 than they were in January 2020, according to CPI data reported by CNBC, and that cumulative increase has continued to grow through 2026 as the Consumer Price Index has kept rising, just at a somewhat slower pace than during the sharpest years of the increase.
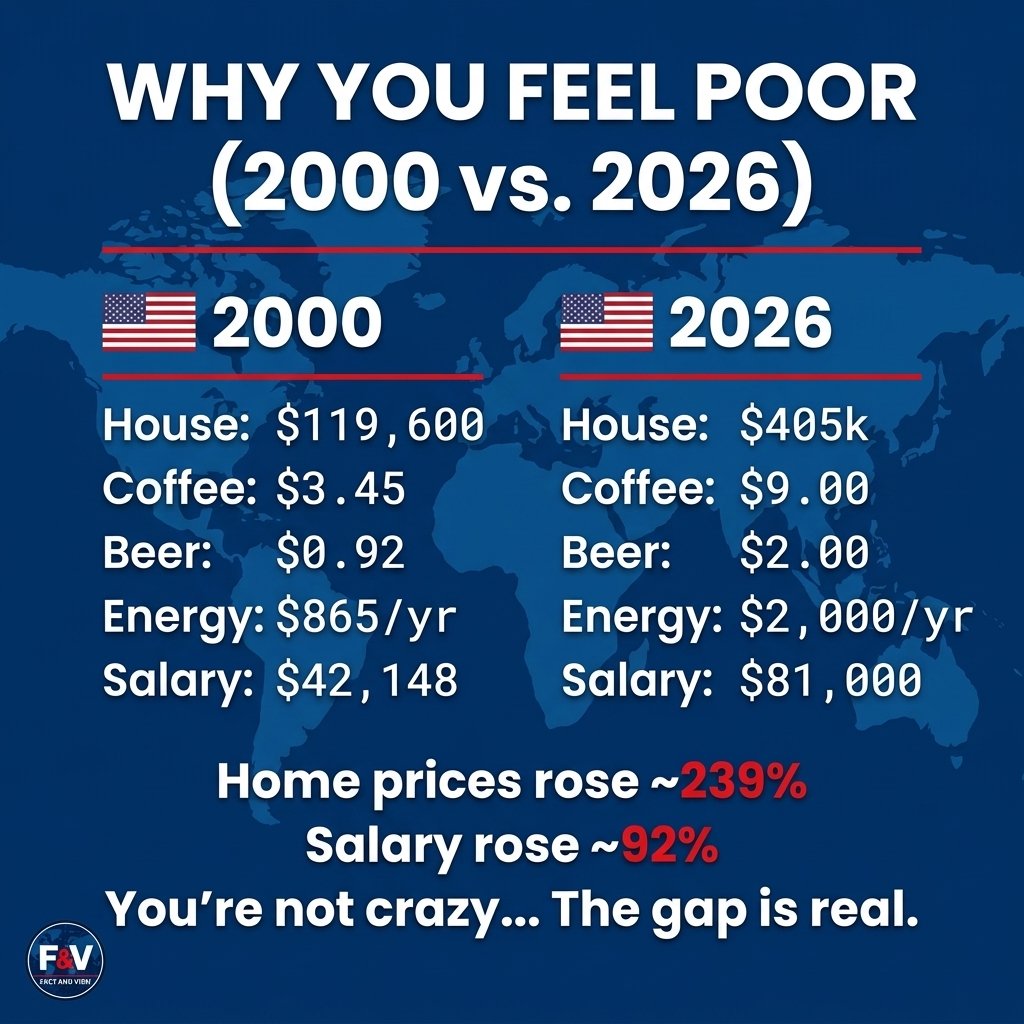
A simple example makes this concrete. Imagine a household’s monthly grocery bill was $600 in January 2020. If overall prices are roughly 25% to 28% higher today, that same basket of groceries now costs somewhere between $750 and $770 a month, a difference of well over $150, every single month, indefinitely, unless prices actually fall, which essentially never happens across the broader economy outside of a severe recession. A slowing inflation rate this year doesn’t shrink that $150 gap; it just means the gap grows more slowly than it did in 2022 or 2023. A grocery bill, rent payment, or insurance premium that’s a quarter higher than five years ago doesn’t feel smaller just because this year’s increase was 3.4% instead of 7%.
BMO Bank chief U.S. economist Scott Anderson described the psychology plainly, telling CNBC that consumers comparing today’s grocery bills to what their money bought years earlier aren’t “walking away with a warm and fuzzy feeling,” regardless of what the year-over-year percentage shows. Prices are compared not just to last year, but to a pre-inflation baseline most people still remember clearly, which is part of why a “cooling” inflation rate doesn’t automatically translate into improved public sentiment.
“How Inflation Affects Your Savings” — related coverage of how the same price and rate environment affects household savings, the flip side of the debt story here.
The Debt Squeeze Behind the Sentiment Numbers
A second, largely separate force is compounding the price-level problem: household debt has grown alongside prices, and a meaningful share of that debt is now going unpaid.
Total U.S. credit card debt reached roughly $1.25 to $1.28 trillion in late 2025 and early 2026, according to the Federal Reserve Bank of New York, up about 63% from the pandemic-era low of $770 billion in early 2021. That increase far outpaces overall inflation over the same period, meaning Americans aren’t just paying more for goods and services; many are borrowing more to cover the difference between rising costs and their available income. The average American now carries about $6,595 in credit card debt, according to Capital One data, at average interest rates above 21%, according to Federal Reserve data, some of the highest average credit card rates on record.
Delinquency rates, the share of balances significantly overdue, have climbed to their highest levels since around 2011 to 2012, according to multiple analyses of New York Fed data, though exact figures vary depending on which delinquency threshold (30-day versus 90-day-plus) is measured, and some figures circulating in financial media have overstated the increase relative to the Fed’s own underlying data. Separately, the New York Fed’s Survey of Consumer Expectations found that the average American-reported probability of missing a minimum debt payment in the next three months rose to 12% in July, up more than a full percentage point from the prior survey, a self-reported measure of financial fragility that has been trending upward for several years.
“Why Mortgage Rates Are Still So High in 2026” — background on how borrowing costs across the economy connect to the same inflation and Fed policy dynamics.
Financial analysts have described a pattern some call “survival debt,” where credit cards increasingly cover essentials like groceries and utility bills rather than discretionary purchases, a shift that signals financial strain regardless of what the aggregate inflation rate is doing. It’s worth noting this pattern isn’t uniform across income levels; available research suggests middle-income households, generally those earning between roughly $40,000 and $75,000 a year, have seen some of the sharpest increases in both balances and delinquency, since this group often earns too much to qualify for public assistance but not enough to have built a meaningful savings cushion against sustained cost pressure.
How the Mechanism Actually Works
Here’s the cause-and-effect chain connecting all of this. Prices rise sharply for a period, as they did starting in 2021 and again during 2026’s energy-driven price shock tied to the conflict involving Iran. Wages for many workers rise too, but usually with a lag, and not evenly across industries or income levels; workers in sectors like financial services, information technology and manufacturing have generally seen stronger wage growth than those in lower-wage service industries, according to Bureau of Labor Statistics wage data. In the gap between rising prices and catching-up wages, many households turn to credit cards to maintain their existing standard of living rather than immediately cutting spending.
That borrowed money isn’t free. It carries interest, often above 21% annually on unpaid balances, which means a household covering a temporary price shock with credit card debt ends up paying considerably more than the original price increase once interest accumulates month after month. As inflation later cools, the original price shock fades from the headlines, but the accumulated debt and its interest charges don’t disappear. They continue drawing down monthly budgets long after the inflation rate that caused them has moved on, which helps explain why sentiment can stay depressed even as the inflation report improves.
This is also why unemployment alone doesn’t capture the full picture of financial stress. The unemployment rate measures whether someone has a job, not whether that job’s income, combined with existing debt obligations, is enough to comfortably cover a cost of living that’s now roughly a quarter higher than it was five years ago. A household can be fully employed, technically “doing fine” by traditional labor market measures, and still be falling behind on payments because of the combined weight of elevated prices and debt taken on to manage them.
“US Debt Has Passed $40 Trillion: How Close Is America to a Debt Crisis?” — related context on debt dynamics at the government level, distinct from but connected to the household debt trends discussed here.
What This Means for American Households
- Grocery and household budgets remain squeezed by a price level that’s roughly a quarter higher than five years ago, regardless of how this year’s specific inflation rate compares with last year’s.
- Credit card holders carrying balances face compounding costs, since average interest rates above 21% mean unpaid balances grow substantially even without any new spending.
- Middle-income households appear to be absorbing a disproportionate share of the recent rise in debt and delinquency, based on available research, since they typically lack both public assistance eligibility and a substantial savings buffer.
- Renters and lower-income households feel cumulative price increases most acutely in categories like groceries and gasoline, which make up a larger share of their overall spending.
- Savers and higher-income households with assets like stocks or real estate have generally seen those asset values keep pace with or exceed inflation, a divergence that helps explain why sentiment doesn’t move uniformly across income groups even when surveys show broad-based improvement or decline.
None of this means every American household is in acute financial distress; unemployment has remained relatively low, near 4.1% as of mid-2026, and sentiment did show a genuine, broad-based recovery over the summer before recent setbacks. But it does mean the “inflation is cooling” headline captures only part of what’s shaping how people feel about their financial situation.
What to Watch Next
- Monthly CPI reports from the Bureau of Labor Statistics, to see whether the core inflation improvement holds or the headline rate reaccelerates.
- University of Michigan and Conference Board sentiment surveys, both released monthly, for signs of whether the recent decline continues or reverses as it did over the summer.
- The New York Fed’s Quarterly Report on Household Debt and Credit, for updated credit card balance and delinquency figures.
- Real wage growth data from the Bureau of Labor Statistics, since wages catching up to cumulative price increases would meaningfully ease the pressure described here.
- The Federal Reserve’s remaining 2026 policy decisions, since interest rates directly affect the cost of carrying existing credit card and other consumer debt.
Falling inflation and persistent financial strain aren’t contradictory; they describe different layers of the same economy. The inflation rate measures how fast prices are currently rising, while consumer sentiment reflects the accumulated weight of five years of price increases, uneven wage growth, and a meaningful rise in household debt that hasn’t gone away just because this year’s inflation numbers look better than last year’s.
What’s clear from the data: prices remain substantially higher than their pre-2020 baseline, credit card debt and delinquencies have climbed to their highest levels in well over a decade, and consumer sentiment has moved in a volatile, uneven pattern that doesn’t track the official inflation rate cleanly. What remains uncertain is whether wage growth, easing debt burdens, or a further slowdown in prices will eventually close the gap between the statistics and how households say they feel, and how long that process might take. For now, both the improving inflation data and the persistent financial strain reported by consumers are real, and neither fully cancels out the other.
Sources :
- U.S. Bureau of Labor Statistics — Consumer Price Index News Release, August 2026
- University of Michigan — Surveys of Consumers
- Federal Reserve Bank of New York — Quarterly Report on Household Debt and Credit
- Federal Reserve Bank of New York — Survey of Consumer Expectations
- Federal Reserve Board — Consumer Credit and Interest Rate Data (G.19)