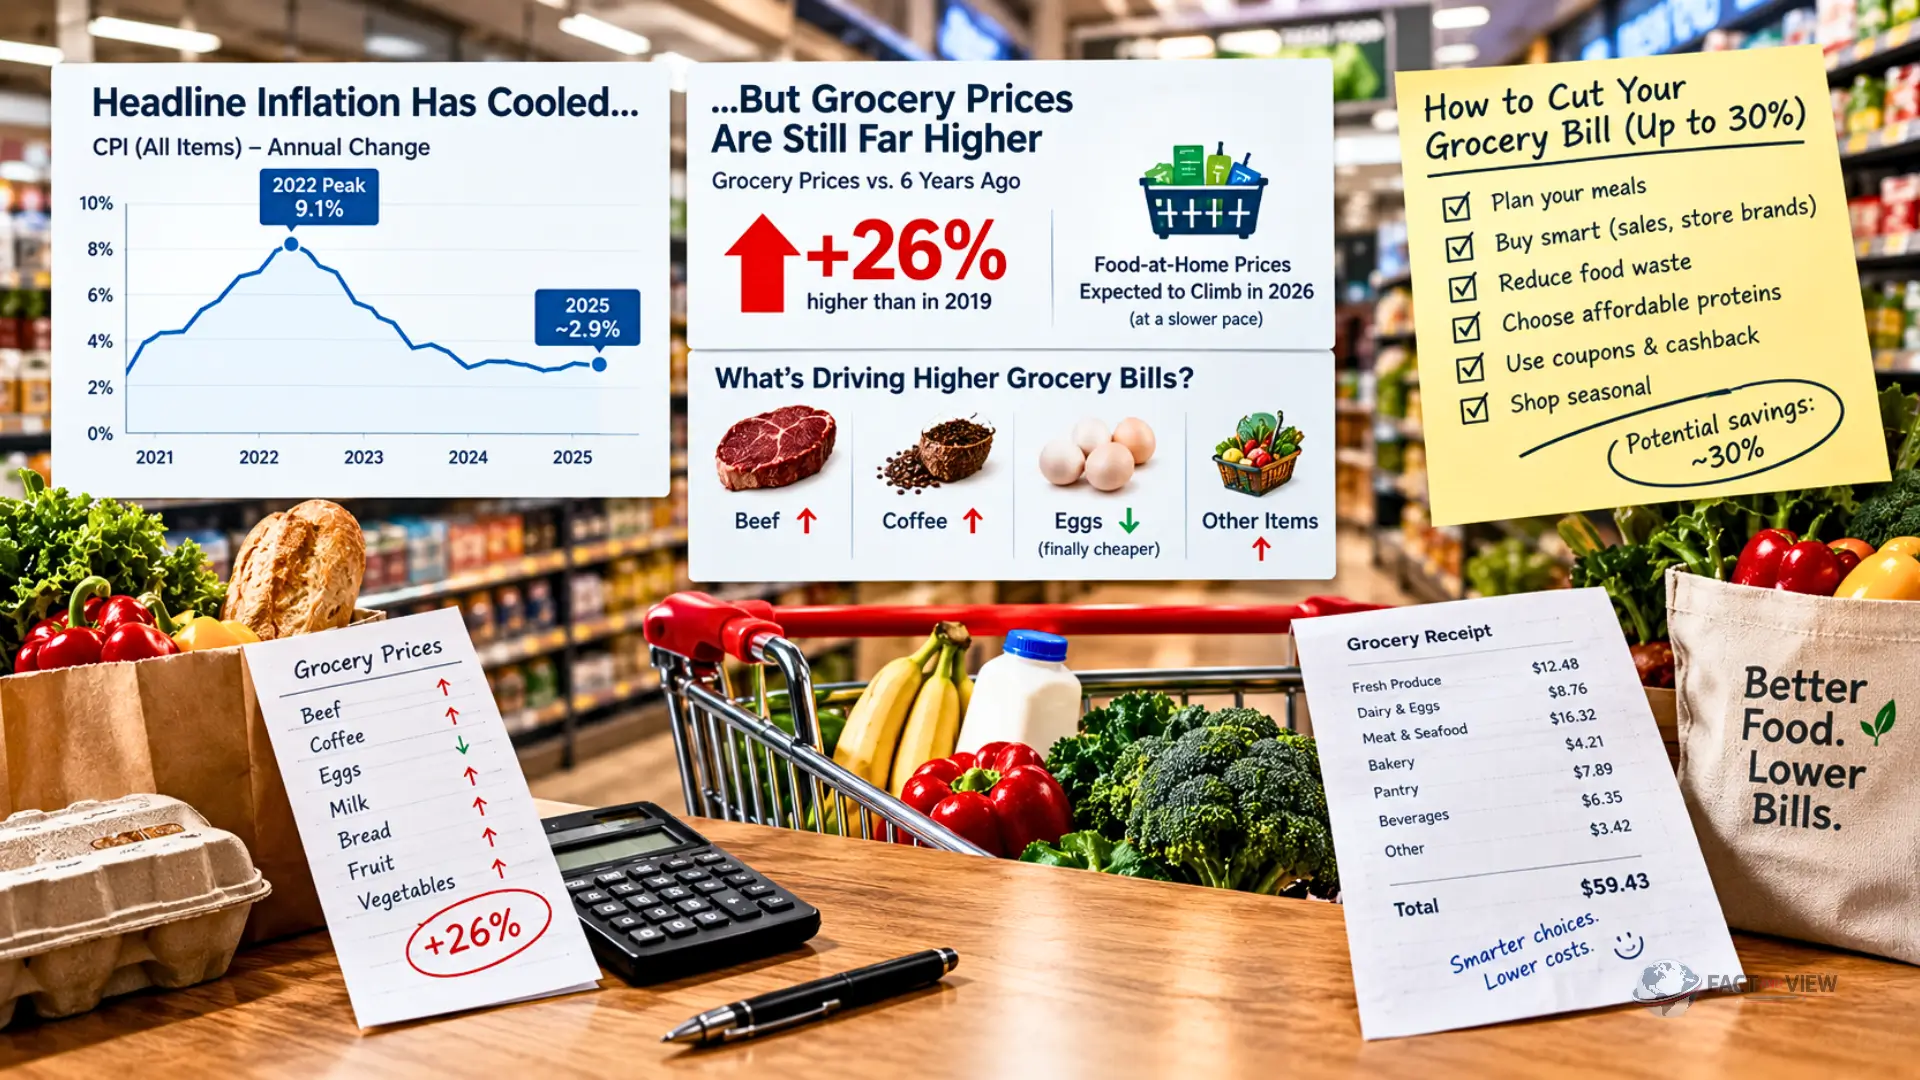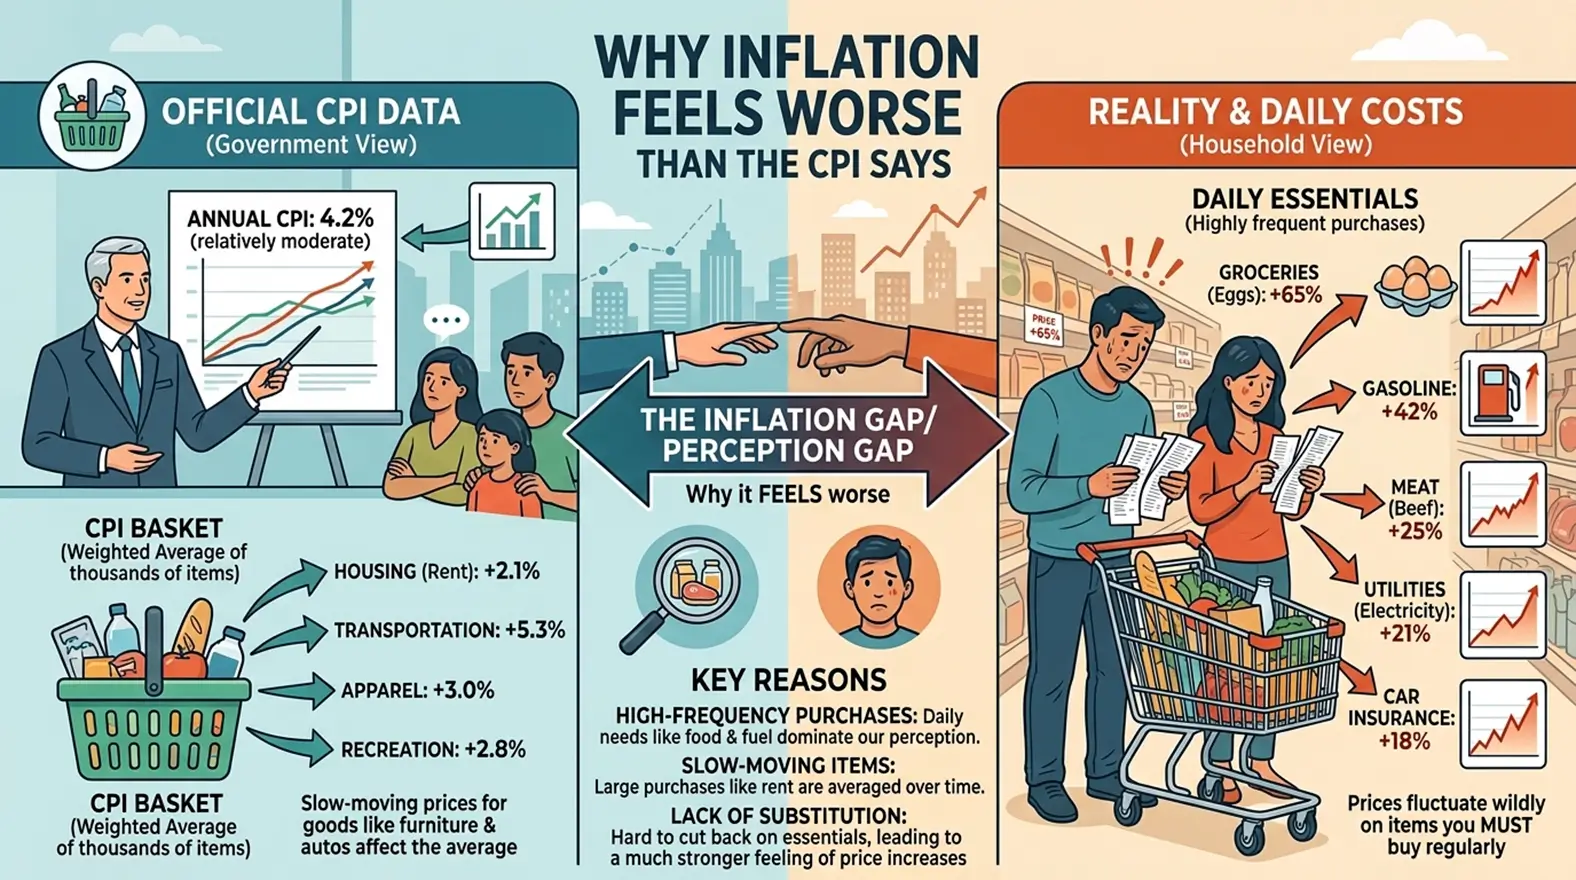
Headline inflation has cooled a lot since its 2022 peak. The Consumer Price Index rose 3.4% over the twelve months ending in August 2026, nowhere near the 9.1% peak from four years earlier. Yet the specific bills that hit your inbox every month, insurance, streaming, electricity, the mechanic, keep climbing anyway.
That’s not a contradiction, and it’s not just a feeling. It’s two different inflation stories running at once, and almost everything in a household’s recurring bills sits in the story that never really slowed down.
This piece looks specifically at recurring bills, not the broader question of why inflation feels worse than the headline number, which FACT AND VIEW has examined from a different angle. Here, the focus is narrower and more concrete: why the specific things you pay for every month keep going up, and what structurally makes them different from everything else in your budget.
One Number, Two Very Different Stories
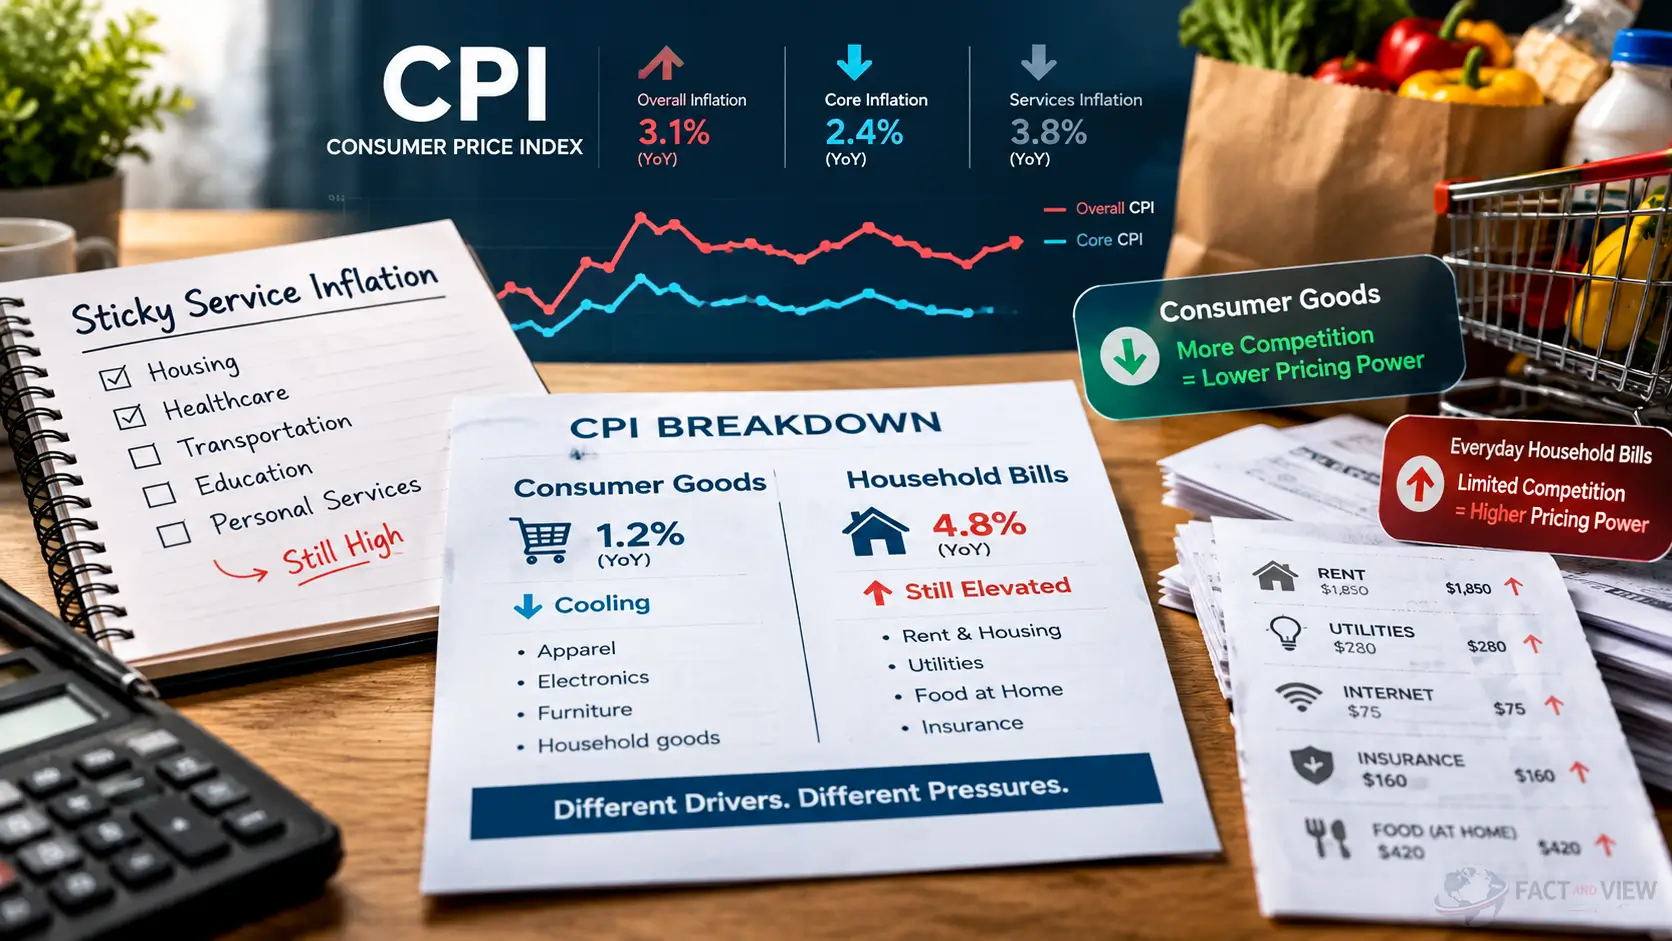
The CPI is a blended average of two categories that behave almost nothing alike: goods and services.
Goods inflation, the price of things like appliances, cars, clothing, and electronics, has been close to flat for most of 2026. Early fall data put core goods inflation around 0.7% year-over-year, a genuinely low number reflecting resolved supply chains and heavy global competition on manufactured products.
Services inflation is a different animal entirely. It’s been the primary driver of the headline number staying above the Federal Reserve’s 2% target, even as goods prices barely moved. Economists sometimes call the narrower version of this, services excluding energy and shelter, “supercore” inflation, and it’s remained the stickiest part of the entire inflation picture through 2026.
The reason for the split is structural, not random. Goods compete globally; a factory in one country competes with a factory in another, which keeps prices in check. Services are mostly local and labor-intensive; a haircut, an insurance policy, or a repair technician’s time can’t be imported from somewhere cheaper, so services pricing tracks wage costs and contract terms far more directly than global supply and demand.
Your Bills Are Almost Entirely “Services”
Here’s the detail that explains most of the frustration: nearly every recurring household bill falls on the services side of that split, not the goods side.
Insurance, cell phone and internet plans, streaming subscriptions, electricity, cable, gym memberships, and most of what shows up as a line item in a budgeting app: all services. Electricity bills specifically have climbed for their own set of structural reasons, and home insurance costs have followed a similar services-driven pattern.
Even a category that sounds like it should track goods inflation often doesn’t. Motor vehicle maintenance and repair, the kind of bill you get when your car needs work, rose 5.2% year-over-year as of the most recent CPI data, more than four times the pace of general goods inflation. That’s because a repair bill is mostly paying for a technician’s labor and a shop’s overhead, not a manufactured part.
So when someone says inflation has cooled but their bills haven’t, the data actually backs them up. They’re not imagining a mismatch between two different averages. They’re living inside the half of the CPI that never cooled nearly as much as the other half.
Case Study: How Streaming Quietly Became a Bill
Subscription services show this pattern in an especially visible way, because the price changes are public and easy to track.
Several major platforms raised prices in 2026 alone:
- Netflix’s Standard ad-free plan rose from $17.99 to $20 a month in March
- Spotify Premium rose from $11.99 to $12.99 a month in February
- YouTube Premium rose from $13.99 to $15.99 a month in April, about a 17% jump
- Apple TV+ rose from $9.99 to $12.99 a month, roughly a 30% increase
Each individual increase looks small, a dollar or two. The effect compounds because the average household subscribes to several of these at once, and because subscriptions renew automatically. Nobody re-decides every month whether $20 for Netflix is still worth it; the charge just goes through.
That’s the quiet mechanism behind a lot of recurring-bill creep. It isn’t one dramatic price hike. It’s several small ones landing in the same month, on autopilot, across services that were never designed to be easy to cancel.
Why Contracts and Renewal Cycles Make Bills Sticky
Services pricing also moves on a different clock than goods pricing, which adds another layer of stickiness.
Housing costs in the CPI are a clear example. Most rental leases run 12 months, so the CPI’s shelter component reflects what rents looked like roughly a year earlier, not current market conditions. That lag means shelter inflation can keep showing up in the data well after the actual turning point in the rental market.
Insurance works on a similar annual cycle. Interest rate changes also take time to show up in what you actually pay, since many service contracts reprice only once a year, at renewal, rather than continuously the way a gas station sign updates. A bill that’s set to rise in January doesn’t care that inflation data released in November looked encouraging.
This Isn’t Just Perception
It’s worth being direct about the distinction from a related but different question: why inflation feels worse than it is.
That question is mostly about psychology and measurement, how people notice price increases more than price decreases, and how a national average can mask what any one household actually buys. This is a different claim, grounded in the CPI’s own published components: services inflation has been running meaningfully hotter than goods inflation for most of 2026, and recurring bills sit almost entirely on the services side. That’s a measurable gap in the data, not a trick of perception.
Who Feels This Most
The burden isn’t spread evenly.
Lower and middle-income households generally spend a larger share of their budget on services like insurance, utilities, and phone or internet plans, and a smaller share on discretionary goods purchases that have gotten relatively cheaper. That means the sticky half of inflation makes up a bigger piece of their monthly outflow than it does for a household with more discretionary spending to cut back on.
Renters feel the shelter-lag effect directly, since the CPI’s delayed read on rental markets means their actual lease renewal can diverge sharply from what the month’s inflation headline implies. And any household juggling multiple subscriptions, several insurance policies, and a phone and internet bill is, by definition, more exposed to services-side price creep than one with fewer recurring line items.
What Could Change This
Services inflation is anchored heavily in labor costs, so it tends to ease only when wage growth itself slows meaningfully, a trend that has already shown signs of cooling through 2026. If that continues, services inflation could gradually follow goods inflation lower, though with a lag, since contract and renewal cycles mean today’s wage data won’t show up in next month’s insurance bill.
Analysts disagree on how long that lag runs. Some point to the shelter component’s roughly 12-month delay as a rough guide for the broader services category; others note that insurance, subscriptions, and utilities each run on their own separate renewal timelines, which could mean the full adjustment takes well into 2027 to show up across every bill a household pays.
What to Watch
- BLS’s monthly CPI report, specifically the services and “supercore” components, not just the headline number
- Your own bills’ renewal dates, since that’s when a sticky annual repricing actually lands
- Wage growth data, since services inflation tends to follow labor costs with a delay
- Sector-specific FACT AND VIEW coverage on insurance, utilities, and housing costs, which track these renewal cycles individually
The Bottom Line
Headline inflation cooling and your bills still climbing aren’t contradictory facts. They’re two readings from the same report, just from different halves of it.
Goods prices, the stuff that’s gotten cheap to import and easy to compare globally, have mostly calmed down. Services prices, the stuff billed to you on a recurring contract by a local or regional provider, haven’t, because they’re anchored in labor costs and renewal cycles that move slowly and separately from the headline number.
What remains uncertain is the timeline. Services inflation typically follows wage growth down, but with a lag that can stretch a year or more across different bill categories. Until that catches up, a shrinking headline inflation number and a growing stack of monthly bills can both be true at the same time.
Sources
- U.S. Bureau of Labor Statistics — Consumer Price Index news release, August 2026, and underlying component data (goods vs. services, motor vehicle maintenance and repair)
- Federal Reserve Bank of Cleveland — CPI nowcast and component analysis, September 2026
- Federal Reserve Bank of Minneapolis — research on core goods inflation trends
- CNET and industry reporting on 2026 streaming service price changes (Netflix, Spotify, YouTube Premium, Apple TV+)