Why Americans Are Spending More Even When Money Feels Tight
Consumer confidence sits near record lows, and Americans keep spending anyway. The University of Michigan’s sentiment index fell to a final reading of 48.1 in September, down 15% from January. Yet retail and food services sales rose 1.2% in August to $774 billion, 6.0% above a year earlier.
The two readings measure different things. Spending counts dollars. Sentiment records how those dollars feel. Higher prices, wealth gains at the top and thinner savings all push the dollar total up while the typical household feels worse off.
This article explains why Americans are spending more, who is doing the spending and what could break the pattern.
The Big Picture
The short answer: four forces keep spending high while budgets feel tight. Prices lift the totals. Wealthy households spend stock market gains. Many families draw down savings or lean on credit. Most workers still have jobs.
Spending is an aggregate. It adds up what high earners, middle-income families and struggling households each spend. A rise in the total says little about whether the typical household can afford its life, which is why a strong spending report and a gloomy survey can both be accurate.
What the Data Shows
- Mood. Michigan’s index fell 7% from August to 48.1. It reached a record low in May.
- Retail sales. August sales rose 1.2% after a 0.5% decline in July.
- Broad spending. Personal consumption expenditures rose 0.9% in August, or 0.6% after adjusting for inflation, while disposable income rose 0.3%.
- Saving. The personal saving rate was 4.1% in August, down from 4.6% in July.
- Jobs and pay. Employers added 29,000 jobs in September, and unemployment was 4.2%. Real average hourly earnings, which adjust pay for inflation, fell 0.3% from August 2025 to August 2026.
Spending outran income. Personal outlays rose $190.7 billion in August, while personal income rose $66.6 billion. One month proves little. July fell, and the Census Bureau revises its advance estimates.
Why Spending Holds Up When the Mood Is Low
Higher prices inflate the totals
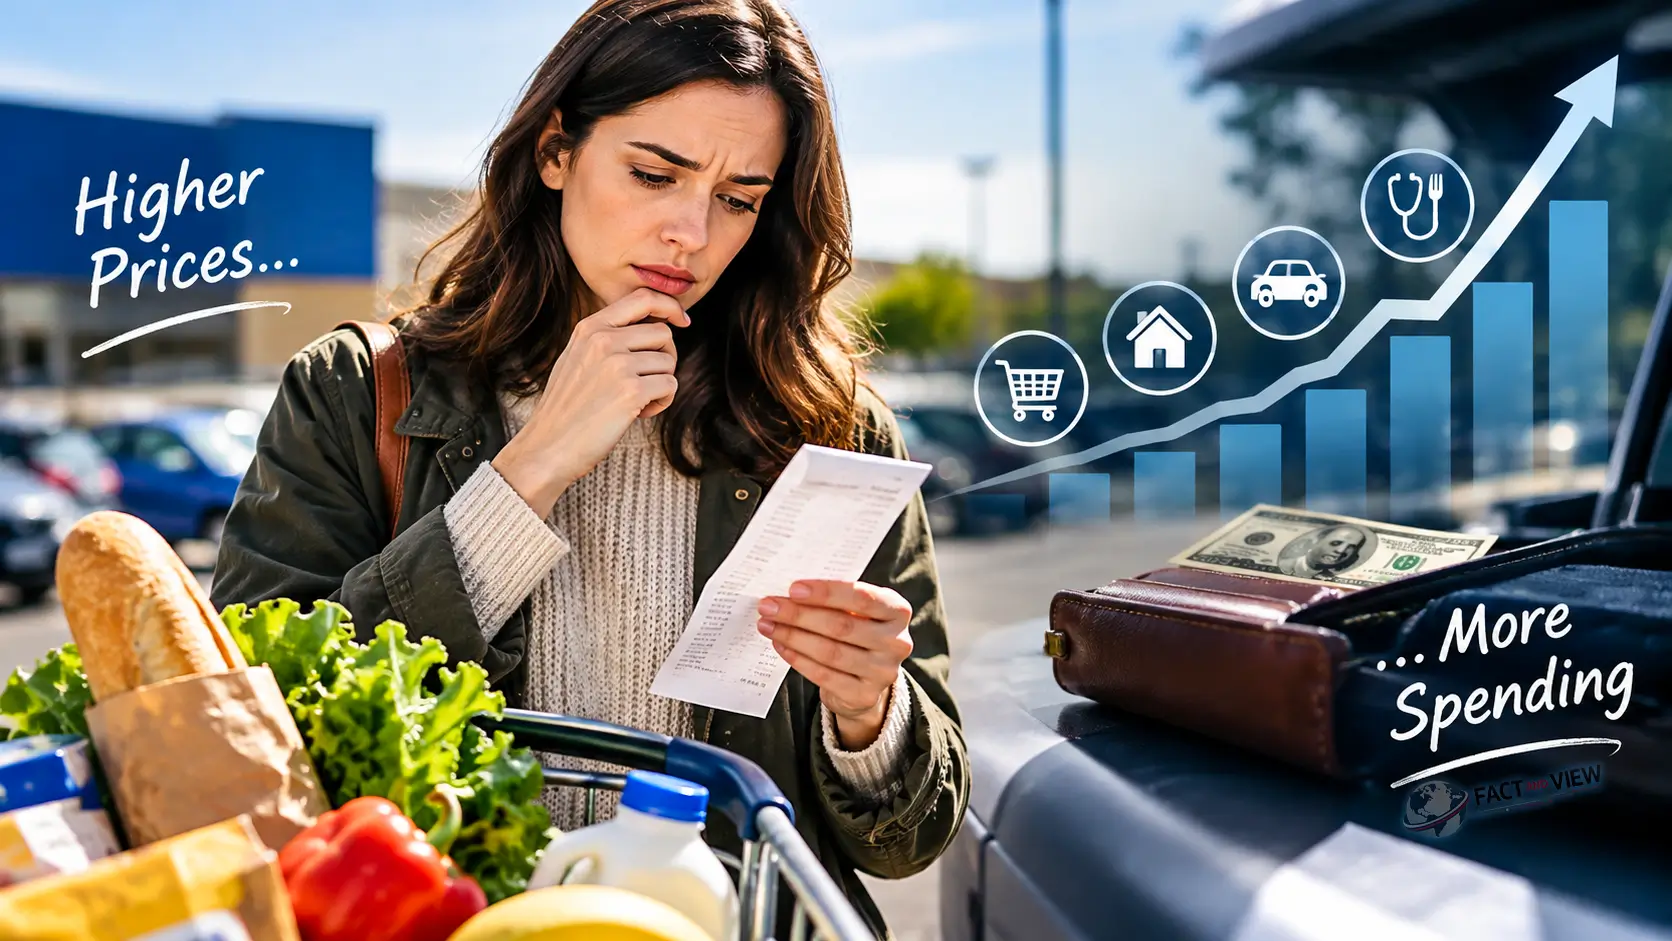
Retail sales count dollars, not items. A driver who fills the same tank at a higher price adds to spending without buying more gasoline.
Gas shows the effect clearly. AAA put the national average at $4.41 on Oct. 1, compared with $3.16 a year earlier, after a record September average of $4.33. Gas station sales rose 3.1% in August. Commuters cannot skip that purchase, so it registers as demand while it squeezes the rest of the budget. The same pressure explains why gas prices are rising so fast in 2026.
Prices do not explain everything. Inflation-adjusted spending also rose in August. Part of August’s jump is a rebound from July’s decline, so the two months partly cancel each other.
Paychecks still arrive
Most Americans who want work have it. Unemployment is 4.2%, and the labor market has cooled sharply without breaking. Workers with steady jobs keep buying groceries, paying for car repairs and going out to dinner.
Pay buys slightly less than a year ago. Hourly earnings rose 3.0% over 12 months, below the 3.4% rise in consumer prices. That gap helps explain why inflation feels worse than the CPI says. Households maintain spending while their purchasing power erodes.
The top of the income ladder drives much of the growth
Spending does not grow evenly. New York Fed researchers found that retail spending growth has been driven by households earning more than $125,000 a year, a K-shaped pattern that has held since 2023. The name describes two arms of a letter: higher-income households move up while others stall.
Stocks supply the fuel. Household net worth rose $12.8 trillion in the second quarter to $195.9 trillion, driven mainly by capital gains on corporate equities. The wealthiest 1% now hold a record 32.5% of household net worth. Economists call this the wealth effect: people who feel richer spend more.
The size of the top group’s share is disputed. Moody’s Analytics estimated that the top 10% of earners accounted for 45.8% of consumer spending in 2025, while the Bureau of Labor Statistics survey put the figure at 22.9% for 2024. The Minneapolis Fed review concluded that the available data do not form a clean K-shaped story. Higher earners matter, but the exact weight remains uncertain.
The sentiment survey points the same direction. Lower- and middle-income consumers and those without stock holdings showed sharper deterioration in August.
Savings and credit fill gaps
The saving rate dropped from 4.6% in July to 4.1% in August. A lower rate means households set aside less of each paycheck, which frees dollars for spending today and leaves less cushion for a surprise.
Credit data show strain at the margins and no broad break. Credit card balances stood at $1.26 trillion in the second quarter, up $54 billion from a year earlier, and 4.7% of household debt was in some stage of delinquency. The quarterly card increase was the smallest second-quarter gain since 2014, excluding 2020, and the share of card limits in use fell to its lowest level since the second quarter of 2023. Statement balances also count purchases that cardholders pay off in full, so a higher balance does not always mean more debt carried. Credit card balances measure spending as much as borrowing.
Student loans look worse. In the second quarter, 10.6% of student loan balances were 90 or more days delinquent. Readers can follow the policy side in student loans and whether forgiveness is still possible.
Why Mood and Spending Drift Apart
Sentiment surveys ask people how they feel about prices, their finances and the year ahead. Spending reflects what people must buy and what they can still afford. The two can diverge for a long time.
In September, Michigan found that views of both current and year-ahead personal finances worsened by about 10%, while worries about high prices intensified. Those answers describe pressure, not a decision to stop buying. A family that dislikes gas at $4.41 still drives to work.
The pattern also reflects habit. Households trim some categories and protect others. Small treats, streaming services and a meal out often survive longer than big discretionary purchases because they cost little per use and feel like a reward for a hard month. Sentiment can stay low for years while spending in those categories holds. The same gap sits behind why Americans still feel poor even when inflation falls.
How the Mechanism Works
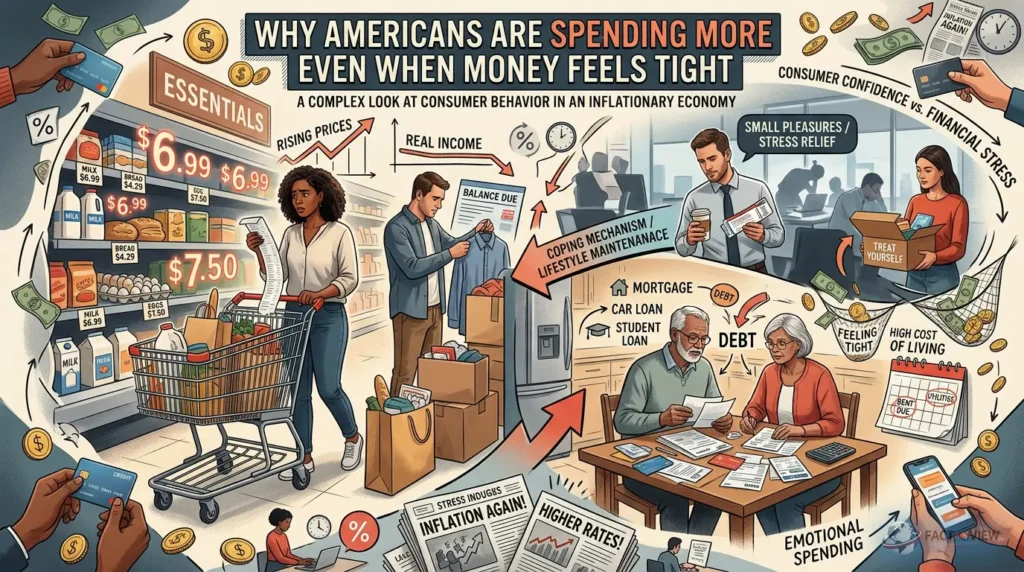
The link between a gloomy mood and steady spending follows a chain:
- Energy costs rise. Higher crude prices raise pump prices, and gasoline spending counts toward the retail sales total.
- Fixed costs absorb income. Rent, insurance, car payments and utilities do not flex, so households keep paying them while less remains for everything else. Why car payments are so high shows how one fixed cost squeezes budgets.
- Households adjust priorities. In May, Navy Federal chief economist Heather Long said Americans were shifting spending priorities to absorb higher gas costs while keeping up with hobbies and entertainment.
- Wealthy households keep spending. Stock gains support travel, dining and services that depend on higher earners.
- The total looks strong. Adding these groups produces solid aggregate spending, even though the median household feels strained.
Interest rates add a second layer. The Federal Reserve’s benchmark rate sits at 3.75% to 4% after the September increase. Higher rates raise the cost of variable-rate debt, including most credit cards. See how interest rates affect your everyday life for the full chain.
Who Is Most Exposed
Households with little stock wealth and a high share of income going to essentials carry the most risk. That group includes many renters, commuters and borrowers with student debt. Unemployment for Black workers rose to 7.0% in September, a reminder that the labor market affects groups differently.
Small businesses face a different exposure. Restaurants, travel companies and retailers that depend on affluent customers benefit from the current pattern, while those serving price-sensitive shoppers feel it first when budgets tighten.
What It Means for Americans
- Household budgets. Spending more does not mean buying more. A rising grocery or fuel bill can look like confidence in the data.
- Credit cards. Balances are growing slowly, and delinquency is steady. A rise in missed payments would signal that savings have run out.
- Savings. At 4.1%, the saving rate leaves a smaller cushion than a year of higher pay would suggest.
- Jobs and wages. Hiring has slowed. If layoffs rise, the spending that depends on paychecks would weaken quickly.
- Investments and retirement. Account balances tied to stocks help the same wealth effect that supports spending. A sharp market decline would work in reverse.
Quick Answers
Why are Americans spending more when money feels tight?
Higher prices raise the dollar total, wealthy households spend stock gains, many families draw on savings or credit, and most workers still have jobs. Spending counts dollars, so it can rise while the typical household buys less.
Is the spending real or just inflation?
Both. Federal data show August spending rose 0.9% before inflation and 0.6% after it, so volume increased. Gas and other price-driven categories still inflate the headline.
Do rich households drive U.S. spending?
They drive much of the recent growth, according to New York Fed research, but estimates of their total share range from about 23% to 46%.
Can the Spending Last?
Several scenarios are possible, and none is certain.
If jobs hold and gas stays near current levels, spending likely grows slowly, with lower-income households carrying more strain. If layoffs increase, a thin saving rate offers little buffer. If stocks fall sharply, the wealth effect reverses, and high earners could pull back.
Easier gas prices would help lower-income households first. The weaker jobs report also raised the likelihood that the Fed leaves rates unchanged in late October, which would keep borrowing costs from rising further for now.
The problem resists a quick fix because the pressure comes from several sources at once. Fuel prices depend on crude oil and events abroad. Insurance and car payments reset slowly. Wage growth trails inflation, and the Fed raised rates in September. No single decision gives lower-income households relief, so the gap between mood and spending can persist even if headline numbers look healthy.
What to Watch Next
- Retail sales. The Census Bureau releases September data on Oct. 15.
- Personal income and outlays. BEA’s September report arrives Oct. 29 and will show the saving rate.
- Consumer sentiment. Michigan’s October readings will show whether the gap with spending narrows.
- Gas prices. Pump prices depend on crude oil and conditions around the Strait of Hormuz.
- Credit data. The next New York Fed household debt report will reveal whether delinquencies rise.
The Bottom Line
Americans are spending more because prices are higher, wealthy households are spending stock gains, and many families are using savings and credit to keep pace. Jobs still support the total. A strong spending report does not show that households feel secure.
The main uncertainty is how much of the total comes from high earners and how much from stretched budgets. Estimates of the top group’s share differ by more than 20 points. Data on one month of spending also revise often.
The most useful signals are payroll growth, the saving rate, delinquency trends and gas prices. If those worsen together, spending could soften even with confident stock investors. Data in this article is current as of Oct. 10, 2026.
Sources:
- BEA, Personal Income and Outlays, August 2026
- Census Bureau, Advance Monthly Retail Trade
- BLS, Employment Situation, September 2026
- BLS, Real Earnings, August 2026
- New York Fed, Household Debt and Credit, Q2 2026
- Federal Reserve, Z.1 Financial Accounts (Sept. 11, 2026)
- New York Fed Liberty Street, “Tracking the K-Shaped Economy”
- Minneapolis Fed, “Have US Consumers Gone K-Shaped?”
- AAA, national gas average (Oct. 1, 2026)
- Advisor Perspectives, on the Moody’s vs BLS spending-share dispute