
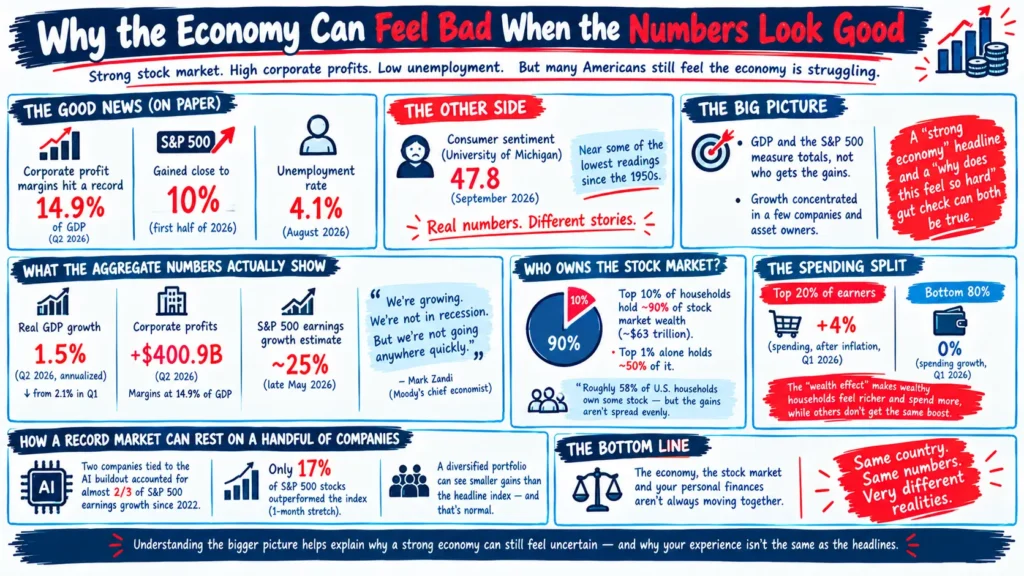
Corporate profit margins hit an all-time high of 14.9% of GDP in the second quarter of 2026, according to the Bureau of Economic Analysis. The S&P 500 gained close to 10% in the first half of the year and kept setting new records. Unemployment sat at 4.1% in August.
Consumer sentiment told a different story. The University of Michigan’s index sat at 47.8 in September, near some of the lowest readings the survey has recorded since it began in the 1950s.
Both sets of numbers are real. Neither one describes the whole economy, because the economy stopped moving as a single unit years ago, and 2026’s data makes the split unusually visible.
The Big Picture
National statistics like GDP and the S&P 500 measure totals. They don’t show who received the gains. Growth concentrated in a small number of companies and asset owners in 2026, and that concentration lets a “strong economy” headline and a “why does this feel so hard” gut check both accurately describe the same year.
What the Aggregate Numbers Actually Show
Real GDP grew at a 1.5% annualized rate in the second quarter, down from 2.1% in the first quarter, according to the BEA’s second estimate. That’s growth, not a recession, but Moody’s chief economist Mark Zandi called the pace “soft,” telling CNBC, “We’re growing. We’re not in recession. But we’re not going anywhere quickly.”
Corporate profits told a sharper story. Profits with inventory and capital consumption adjustments jumped $400.9 billion in the second quarter alone, pushing margins to that 14.9%-of-GDP record. The S&P 500’s 2026 earnings growth estimate ran near 25% as of late May, according to Schwab’s market research.
None of this data misleads on its own terms. GDP, profits and stock prices measure genuine national output and corporate performance. The disconnect starts with what happens to that output after companies generate it.
Why the Stock Market and Your Paycheck Measure Different Things
Roughly 58% of U.S. households own some stock, according to the Federal Reserve’s Survey of Consumer Finances, a figure people often cite to argue that market gains reach most Americans. The ownership math tells a narrower story. The wealthiest 10% of households hold about 90% of all stock market wealth, close to $63 trillion, and the top 1% alone hold roughly half of it, according to Federal Reserve data compiled by market analysts. A retirement account with a few thousand dollars in index funds sits in the same “58% who own stock” category as a portfolio worth tens of millions, but a market rally changes those two households’ lives on completely different scales.
J.P. Morgan Private Bank senior markets economist Joe Seydl put the underlying issue plainly to CNBC: the stock market and the economy are “two very different phenomena,” despite a widespread assumption that the two should move together. Stock prices reflect expected future corporate profits. GDP reflects total economic output, most of which flows through wages rather than dividends or capital gains. A company can post record profits while giving its workers a 3% raise, and both numbers land honestly in different reports.
The spending data confirms the split. Spending among the top 20% of earners grew about 4% after inflation in the first quarter of 2026, according to Moody’s Analytics research cited by CNBC. Spending among the bottom 80% didn’t grow at all over the same stretch. Economists call this the “wealth effect”: rising portfolios make wealthy households feel richer and spend accordingly, while households without meaningful investments never receive that boost, regardless of what the S&P 500 does.
How a Record Stock Market Can Rest on a Handful of Companies
The 2026 market carries a second layer of concentration worth understanding, because it changes who benefits even within the pool of stock owners.
Two companies tied to the AI buildout accounted for almost two-thirds of the growth in S&P 500 earnings since OpenAI released a free version of ChatGPT in late 2022, according to Moody’s Analytics data reported by CNBC. Broader market participation has narrowed alongside that concentration: only about 17% of S&P 500 stocks outperformed the index itself over a recent one-month stretch, according to Schwab’s market commentary, one of the lowest readings of the past decade.
A retirement account holding a broad S&P 500 index fund still benefited from this run, since those two companies pulled the entire index higher. An investor holding a diversified mix of smaller or non-tech stocks saw a smaller gain than the headline index number suggests. So did a worker whose 401(k) sits mostly in bonds and cash equivalents. The market and the average individual stock haven’t moved together for some time, and 2026 stretched that gap further.
A Pattern With Roots Before 2026
This split didn’t start this year. Economists have used the term “K-shaped economy” since the early pandemic recovery to describe a pattern where one group’s fortunes rise while another’s fall or stagnate, forming the two diverging strokes of the letter K. The Federal Reserve’s response to the 2008 financial crisis and the 2020 pandemic both involved cutting interest rates toward zero, a policy that pushed investors into stocks and real estate in search of returns and inflated asset prices for people who already owned assets.
The S&P 500 has gained more than 700% since its 2009 financial crisis low, according to market data widely cited by investment researchers. Households that held stocks through that entire period built substantial wealth. Households that didn’t, often because they lacked savings to invest in the first place, missed a 17-year run that never touched their finances. Wage growth over the same period ran far below that pace for most workers. Today’s gap between GDP and consumer sentiment sits on top of a wealth divide that compounded for close to two decades before 2026 arrived.
The Debt and Confidence Side Most Headlines Skip
Rising asset prices for the top of the distribution coincide with rising financial strain lower down it. Total U.S. credit card debt reached roughly $1.25 to $1.28 trillion in late 2025 and early 2026, according to the Federal Reserve Bank of New York, up 63% from the pandemic-era low of $770 billion in 2021. Delinquency rates on that debt climbed to their highest levels since around 2011 to 2012.
The New York Fed’s Survey of Consumer Expectations found the average reported probability of missing a debt payment in the next three months rose to 12% in July, and consumer sentiment fell for a second straight month in September even as GDP and profits posted the numbers described above. A household carrying credit card debt at an average rate above 21% experiences 2026 through rising minimum payments. The S&P 500’s quarterly performance changes nothing about that bill.
Roughly half of Americans polled this year incorrectly believed the stock market was down for the year while it sat at record highs, according to survey data reported by financial analysts tracking the disconnect. That gap between perception and reality runs in both directions: some people underestimate genuine market strength, and others correctly sense that the strength never reached their own finances.
Two Households, One Set of Headlines
A household holding $500,000 in a stock portfolio and no credit card debt watched that portfolio grow by roughly $50,000 in 2026, tracking the S&P 500’s gains. Rising prices at the grocery store barely register against that kind of paper gain, and the “record highs” headline matches their lived experience almost exactly.
A household with no investment account and a $6,595 credit card balance, the national average reported by Capital One, paid roughly $115 a month in interest at the 21% average rate the Federal Reserve tracks. Their income rose with the 0.3% August wage gain reported by the BLS, a few dollars a week, while grocery, gas and insurance costs climbed faster than that raise covered. The same “record highs” headline describes a year this household never felt.
Neither household is lying about their experience of 2026. Both are reading the same economy from opposite ends of the wealth distribution.
What This Means for Different Americans
- Households with significant stock holdings or company equity, concentrated among the top 10% of earners, have lived through 2026 as a strong year, with portfolio values and spending power both rising.
- Wage-dependent workers without meaningful investment accounts have experienced a much flatter year. Their income depends on hourly earnings growth, which rose 0.3% in August, according to the Bureau of Labor Statistics, a pace that stays just ahead of inflation running at 3.4%.
- Households carrying credit card or other variable-rate debt face a second pressure entirely disconnected from the stock market: interest costs that climb with the Federal Reserve’s rate decisions and cut directly into monthly budgets.
- Renters and non-homeowners miss out on both the stock market wealth effect and the home equity gains flowing to owners in many regions, They absorb rising costs without a comparable asset gaining value in response.
- Small business owners without institutional-scale market exposure experience the economy mainly through demand from the bottom 80% of consumers, the group whose spending stayed flat in early 2026, rather than through the corporate profit and market data dominating national headlines.
The strong aggregate numbers stand on their own. The average American’s paycheck, debt load and spending power still respond to a different set of forces than the ones driving GDP, corporate earnings and the S&P 500 this year.
What to Watch Next
- The Bureau of Economic Analysis’s Q3 GDP estimate, to see whether growth stabilizes near 1.5% to 2% or shifts meaningfully in either direction.
- Monthly jobs reports and wage growth data from the Bureau of Labor Statistics, the clearest read on whether income gains for wage-dependent workers start closing the gap with corporate profit growth.
- S&P 500 market breadth, meaning how many individual stocks participate in gains rather than a handful of mega-cap companies carrying the index.
- University of Michigan and Conference Board consumer sentiment surveys, released monthly, for signs of whether the gap between sentiment and GDP narrows or widens.
- The New York Fed’s Household Debt and Credit Report, updated quarterly, for the latest read on credit card balances and delinquency trends.
The Bottom Line
GDP, corporate profits and the S&P 500 all point to a growing, profitable economy in 2026, and that data holds up. Consumer sentiment near record lows and rising household debt delinquencies hold up too. They measure a different, larger share of the population that hasn’t shared in those gains at the same rate.
The known facts: stock ownership concentrates heavily among the wealthiest 10% of households, two AI-linked companies drove most of this year’s market gains, and spending growth split sharply between the top 20% of earners and everyone below them. The open questions are whether wage growth accelerates enough to narrow that gap, whether market gains eventually broaden beyond a handful of companies, and how long households can sustain rising debt loads if delinquency trends continue. The GDP report, the jobs report and the Fed’s rate decisions, tracked together rather than in isolation, will show whether 2026’s two economies move back toward one or keep drifting apart.
Continue reading from Fact and View:
- “Why Americans Still Feel Poor Even When Inflation Falls” for the household debt and sentiment data referenced here.
- “How Interest Rates Affect Your Everyday Life” for background on how Fed policy affects the wage-dependent households described above.
- “Why Prices Are Still Rising in 2026 Even as Inflation Cools” for related coverage of the gap between aggregate data and lived experience.
- “How Inflation Affects Your Savings” for the savings side of the divide between asset owners and everyone else.
Sources:
- U.S. Bureau of Economic Analysis, Gross Domestic Product, Second Quarter 2026
- U.S. Bureau of Labor Statistics, Employment Situation, August 2026
- Federal Reserve, Survey of Consumer Finances
- Federal Reserve Bank of New York, Household Debt and Credit Report
- Federal Reserve Bank of New York, Survey of Consumer Expectations
- University of Michigan, Surveys of Consumers