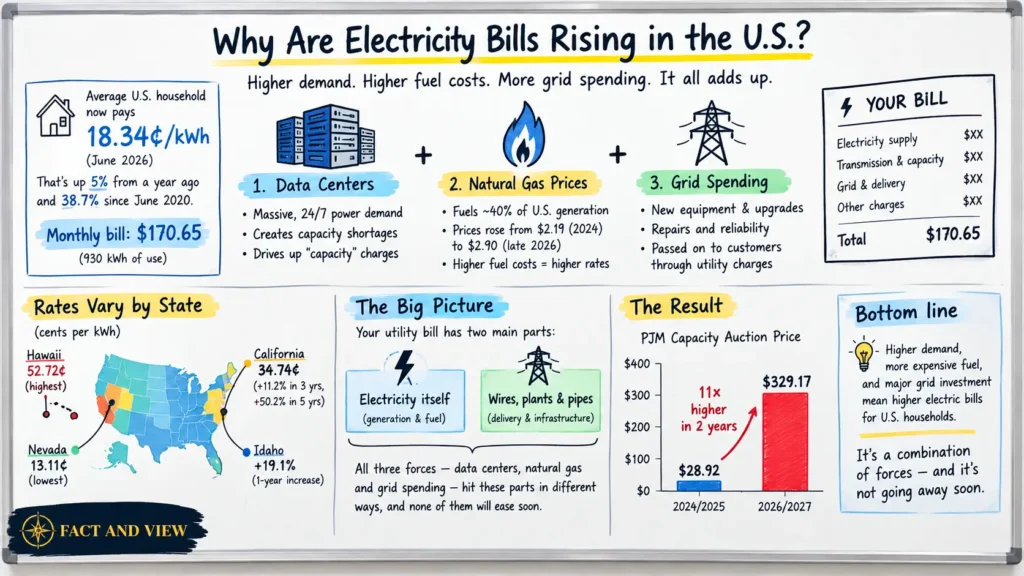
Your electric bill has grown for six straight years. The average U.S. household paid 18.34 cents per kilowatt-hour in June 2026, according to the Energy Information Administration, up 5% from a year earlier and up 38.7% since June 2020. The average monthly bill now runs $170.65 for 930 kilowatt-hours of use.
Three forces built that number: a surge in electricity demand from data centers, a jump in the price of natural gas, and a wave of grid spending utilities pass to customers. Each shows up on your bill in a different way, and each moves on its own timeline.
The Big Picture
Your utility bill has two main parts: the electricity itself and the cost of the wires, plants and pipes that deliver it. Data centers push up the first part by draining a limited supply of power. Natural gas prices push up the same part through fuel costs. Grid spending pushes up the second part, through charges utilities add for new equipment and repairs. None of these three forces will ease in time to help next month’s bill.
What’s Actually Happening to Your Bill
Rates vary by a wide margin from state to state. Hawaii residents pay 52.72 cents per kilowatt-hour, the highest in the country, while Nevada residents pay 13.11 cents, the lowest. California sits at 34.74 cents, up 11.2% over three years and 50.2% over five. Idaho jumped 19.1% in a single year, the sharpest one-year move of any state tracked by the EIA.
That spread matters. A national average hides real differences in what drives costs from state to state. A household in Dominion Energy’s Virginia service territory faces capacity charges 65% higher than the rest of the mid-Atlantic grid, according to grid monitor Monitoring Analytics, because that region hosts one of the country’s largest data center clusters. A household in a state without heavy data center growth feels a different set of pressures.
Why Data Centers Are Driving Up Prices
Data centers, the ones built for AI in particular, consume power around the clock at a scale most other customers never approach. In the grid that covers 13 states from Illinois to Virginia, known as PJM, this demand created a shortage. Customers pay for that shortage on every bill.
PJM buys electricity capacity, the promise that enough power plants will be available when demand peaks, through an annual auction. That auction cleared at $28.92 per megawatt-day for the 2024/2025 delivery year. Two years later, for 2026/2027, it cleared at $329.17 per megawatt-day, the maximum allowed under the market’s price cap. That’s an eleven-fold increase in two years.
Monitoring Analytics, the independent firm that oversees the PJM market, attributed 63% of the most recent price jump to data center demand, translating to $9.3 billion in added costs that utilities now recover from customers. Households in western Maryland pay about $18 more a month because of this single auction result. Ohio households pay about $16 more.
The supply side hasn’t kept pace. PJM’s 2027/2028 capacity auction, held in early 2026, revealed a shortfall of 6,623 megawatts, the first time in the grid operator’s history that the auction covering its entire footprint failed to clear enough supply to meet the reliability target. New power plants take years to permit and build. Data centers go up faster.
Why a Capacity Auction Moves Your Bill at All
A capacity auction pays power plant owners to keep plants available for the hours when demand peaks, even hours that happen only a few days a year. Think of it as a standby fee rather than a charge for electricity used. PJM sets a target for how much standby capacity the grid needs, plant owners bid in the price they need to keep that capacity ready, and the auction clears at the price that matches supply to the target.
New data centers sign up for gigawatts of power before a single new plant comes online. PJM’s target stays the same while competition for existing capacity tightens, and plant owners can charge more because the grid operator has fewer alternatives to choose from. That higher clearing price becomes a line item, often labeled “capacity” or “transmission and capacity charges,” on every residential bill in the region, whether or not that household lives anywhere near a data center.
Why Natural Gas Prices Matter to Your Electric Bill
Natural gas fuels close to 40% of U.S. electricity generation, so its price flows into your electric rate with little buffer in between. The Henry Hub benchmark price, the standard reference for U.S. natural gas, traded near $2.90 per million BTU in late September 2026, up from an average of $2.19 in 2024. The EIA’s own forecasts put the full-year 2026 average higher still, in a range of $3.40 to $4.30 per million BTU, as LNG export demand grows and winter heating season pulls more gas out of storage.
A power plant burning gas at $2.90 per million BTU produces cheaper electricity than one burning gas at $4. Utilities pass that fuel cost through to customers, often through a line item separate from the base electricity rate. Your bill can rise even when your usage stays flat.
Why Grid Spending Shows Up on Your Bill
Utilities plan to spend up to $1.4 trillion on infrastructure between 2025 and 2030, covering transmission lines, substation upgrades, wildfire and storm hardening, and new connections for growing demand, according to industry estimates cited by multiple energy research firms. State regulators approve these projects and set the rate of return utilities earn on them, then utilities recover the cost from customers over decades through regulated rates.
Utilities can’t defer most of this spending. Aging transmission lines need replacement whether or not data center demand exists, and utilities in wildfire-prone states face pressure to harden their systems after past disasters triggered lawsuits and bankruptcies. The cost lands on your bill either way, spread across the customer base instead of billed to any single driver of demand.
How the Three Forces Combine on Your Statement
A residential electric bill has three components working at once, and separating them explains why the total keeps climbing even when any one piece looks manageable.
The energy charge covers the electricity you actually use, priced against wholesale power costs that rise when natural gas gets more expensive or when capacity auctions like PJM’s clear at record highs. The delivery charge covers the wires and equipment that carry electricity to your home, and it rises as utilities recover infrastructure spending approved by state regulators. Taxes and fixed customer charges make up the rest, and those tend to rise more slowly but still add to the total over time.
Data center demand and natural gas prices hit the energy charge. Grid spending hits the delivery charge. A bill can rise because of either one alone, and 2026 has brought pressure on both at once.
One Household’s Bill, Broken Down
Take the average U.S. household, paying $170.65 a month for 930 kilowatt-hours. A year earlier, that same household paid $165.52 for slightly more usage, 947 kilowatt-hours, at a lower rate of 17.48 cents per kilowatt-hour. The dollar gap, about $5 a month, looks small next to a $170 bill. Multiply it across 130 million U.S. households and the national total runs into the billions.
Now place that household in western Maryland instead of the national average. Add the $18 a month tied directly to the PJM capacity auction, on top of the same natural gas and delivery pressures every other household faces. The national increase and the regional increase are not the same number, and a bill in a heavy data center corridor reflects both at once.
What This Means for American Households
- Households in PJM states, including Ohio, Maryland, Virginia, Pennsylvania and Illinois, face the most direct exposure to data center-driven capacity costs, with some regions seeing $16 to $18 in added monthly costs from a single auction cycle.
- Households that heat with electricity in colder states will feel natural gas price increases twice, once through their electric bill and again if they also use gas directly for heat.
- Low-income households spend a larger share of income on electricity than higher-income households, so the same percentage increase creates a bigger budget strain for them.
- Renters often can’t choose their utility provider or negotiate rate structures. Homeowners can invest in efficiency upgrades or solar; most renters can’t.
- Small businesses with high electricity use, including restaurants, manufacturers and retailers with heavy refrigeration or equipment needs, face the same capacity and fuel cost pressures as households, often without the rate protections some residential customers receive.
None of this points to a national electricity crisis. It does mean the source of the increase in your specific state determines how long the pressure lasts and whether it’s likely to ease.
What to Watch Next
- PJM’s next capacity auction, typically held in July, for a signal of whether data center-driven prices keep climbing or start to moderate as new supply comes online.
- EIA’s monthly Short-Term Energy Outlook, which updates natural gas price forecasts and electricity price projections.
- State utility rate cases, where regulators approve or reject the infrastructure spending utilities want to recover from customers.
- New generation announcements in PJM and other tight regions. New power plants take years to build, but each one eases the supply shortage behind capacity prices.
- Winter natural gas demand, which tends to push Henry Hub prices higher and flows into electric bills one to two months later.
The Bottom Line
Three distinct pressures are hitting the grid at the same time: data centers consuming power faster than new plants can be built, natural gas costs feeding into generation prices, and utilities recovering years of infrastructure investment through regulated rates. None of these forces is temporary in the way a short-term fuel spike would be.
Your own location determines which pressure hits hardest. A household in Ohio or Maryland absorbs a PJM capacity auction result most states never see on their bill. A household in a state with modest data center growth instead feels natural gas prices and grid spending more directly. The pace of new power plant construction, and whether natural gas prices climb further as LNG exports and winter demand pull on supply, will decide where rates go from here. The EIA’s monthly forecasts and the next PJM auction result carry more predictive weight than any single explanation offered today.
Continue reading from Fact and View:
- “Why Gas Prices Are Rising So Fast in 2026” for a related look at how a different energy market reached record levels this year.
- “Why Prices Are Still Rising in 2026 Even as Inflation Cools” for context on how energy costs specifically shape the broader inflation picture.
- “How Interest Rates Affect Your Everyday Life” for background on how utility infrastructure spending gets financed and repaid over time.
- “Why Americans Still Feel Poor Even When Inflation Falls” for related coverage of how rising fixed costs strain household budgets.