Are American Paychecks Keeping Up With the Cost of Living?
In September 2026, the Census Bureau delivered good news. Real median household income hit $87,460 in 2025, the highest figure on record since the government started tracking it in 1967. Weeks earlier, the Bureau of Labor Statistics had delivered a very different number. Real average hourly earnings, what an hour of work actually buys after accounting for prices, fell 0.3% over the twelve months through August 2026.
Both figures come from the federal government. Neither is wrong. They measure different things over different stretches of time, and that gap explains why “the economy is fine” and “my paycheck doesn’t stretch as far” can both show up in the same week’s headlines.
Here is what the data actually shows about American pay right now, why the picture flipped partway through 2026, and who is feeling it first.
Nominal Pay vs. Real Pay: The Distinction That Decides Everything
Every raise sounds good until you check what it buys. A 3% raise feels like progress. It isn’t, if prices rose 4% over the same period.
Economists split wages into two categories. Nominal wages are the dollar figure on a paycheck, the number most people mean when they talk about a raise. Real wages take that figure and adjust it for the Consumer Price Index, the Bureau of Labor Statistics’ main inflation gauge, to show what the paycheck actually buys.
When nominal wage growth outruns inflation, real wages rise and households gain purchasing power. When inflation outruns nominal wage growth, real wages fall, even as the number on the pay stub keeps climbing. The official inflation rate can understate how expensive life feels, for reasons FACT AND VIEW has covered separately.
That distinction is why “are wages keeping up with inflation” has no single permanent answer. It has an answer for this specific month, and that answer has flipped twice in the past five years.
The Current Numbers: A Paycheck Losing Ground Again
Start with where things stand today.
The Consumer Price Index rose 3.4% over the twelve months ending in August 2026, according to the Bureau of Labor Statistics, matching July’s pace. Core inflation, which strips out food and energy, came in at 2.4%. A related measure, the CPI for Urban Wage Earners and Clerical Workers, which the government uses to calculate Social Security’s annual cost-of-living adjustment, rose even faster, up 3.5%. Those headline numbers sit well above the Fed’s 2% target, and plenty of specific household costs are rising faster still.
Average hourly earnings for private-sector workers rose 3.1% over the same twelve months, to $37.75 an hour, the Labor Department reported in its August jobs report. That is the slowest pace of nominal wage growth since May 2021, down from 3.2% in July.
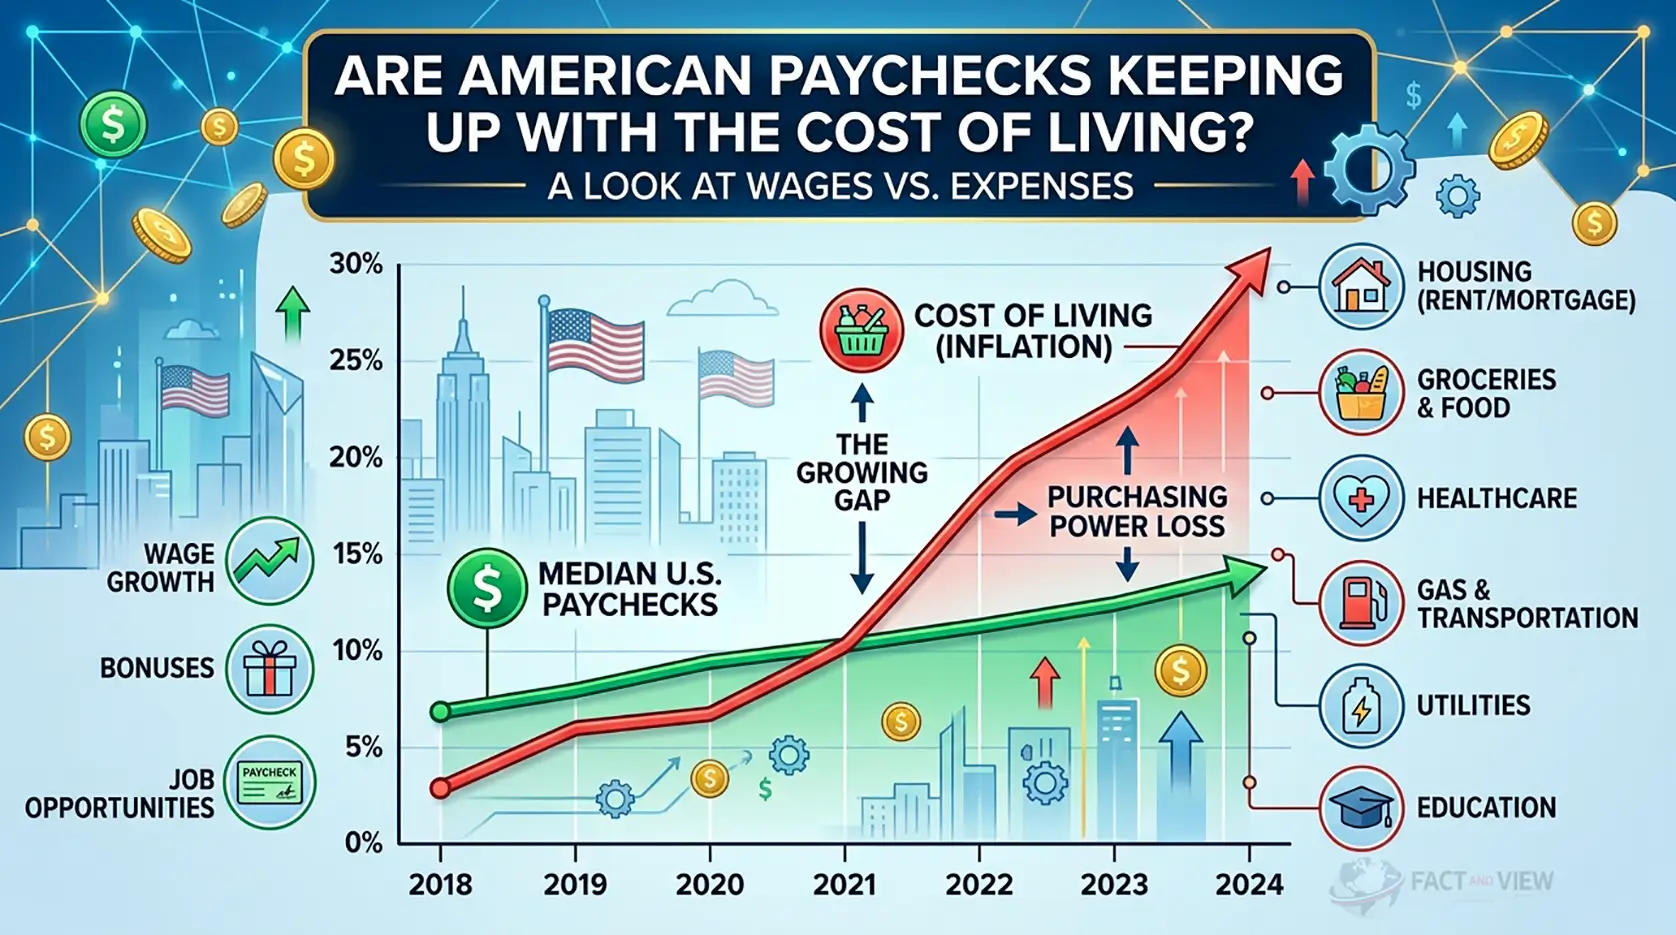
Subtract inflation from that nominal figure and the picture turns negative. BLS’s own real-earnings release puts real average hourly earnings down 0.3% for all employees over the year ending in August, and down 0.1% for production and nonsupervisory workers, the roughly 80% of the private workforce that includes most hourly and frontline jobs. July and April told a similar story, both posting real wage declines on a year-over-year basis. A few months earlier in 2026, March among them, still showed small real gains, which is part of why the trend can feel confusing depending on which month’s headline a reader happens to catch.
Line those months up and a pattern appears. Real wage growth has hovered near zero and tipped negative through most of 2026, a reversal from the solid gains households saw in 2024 and early 2025.
How We Got Here: Five Years, Two Reversals
To understand why this feels disorienting, it helps to see the whole arc.
Inflation surged starting in 2021, peaking at 9.1% in June 2022, the fastest pace in four decades. Nominal wages rose too, but not fast enough. From April 2021 to April 2023, real average hourly earnings fell for 25 straight months on a year-over-year basis, according to Labor Department data, eroding purchasing power by roughly 4% cumulatively over that stretch. Economists at the Peterson Institute for International Economics tracked the same pattern in salaries and wages for civilian workers more broadly, not just hourly pay.
Starting in May 2023, the relationship flipped. Inflation cooled faster than nominal wage growth slowed, and real wages began rising again, month after month. That recovery continued through 2024 and into 2025, helped by a labor market that stayed tight enough to keep raises coming even as price growth eased.
The Census Bureau’s income data captures the payoff. Real median household income climbed to $87,460 in 2025, up 2.6% from 2024’s $85,210. Post-tax median income rose even faster, up 3.1% to $76,060.
But household income is an annual, backward-looking snapshot covering all of 2025. The hourly-earnings data is monthly and current, and it’s the monthly data that turned in 2026. By spring, nominal wage growth had begun cooling faster than inflation, and the real-wage line crossed back below zero for the first time since the 2023 turnaround.
Americans, in other words, are standing on two different data points depending on which one gets held up: a record income year that just closed, and a pay squeeze unfolding right now.
Why Paychecks Are Losing Ground in 2026
Three forces are feeding the reversal.
Tariffs are reaching the register. Research from the Federal Reserve Bank of New York estimates that every one-percentage-point increase in tariffs lifts consumer goods prices by roughly a quarter of a percent within a year, and that the effect on consumer goods inflation peaked around February 2026. A separate New York Fed survey published in July found that nearly half of tariff-paying firms, in both services and manufacturing, still planned further price increases, meaning the pass-through from tariffs to shelf prices is not finished even now.
Energy prices spiked. A conflict involving Iran pushed oil and fuel prices sharply higher through the back half of 2026, with gasoline running roughly a third above year-ago levels by September. Energy costs flow quickly into headline CPI and into the cost of running a household, a car, or a business.
The Fed changed direction. After holding its benchmark rate at 3.50% to 3.75% for five straight meetings, the Federal Reserve raised rates a quarter point, to a range of 3.75% to 4.00%, on September 16, 2026, the first increase since July 2023. New Fed Chair Kevin Warsh cited persistent inflation and said the central bank needed clearer evidence that price growth was heading back to its 2% target. The move pushed borrowing costs higher across the parts of the economy households touch most directly, mortgages included.
Layer a cooling labor market on top of that. Nominal wage growth typically slows when hiring slows and workers have less leverage to negotiate raises. The combination, firmer prices and softer pay growth, is exactly the mix that pushes real wages down.
Who’s Feeling the Squeeze First
The national averages hide a lot of variation.
Job switchers continue to out-earn people who stay put. The Atlanta Fed’s Wage Growth Tracker put nominal pay gains for job switchers at 4.4% in the three months ending July 2026, compared with 3.6% for job stayers, a gap that tends to widen whenever employers get stingier with raises for their existing staff.
Lower-wage and hourly workers carry more of the real-wage decline. BLS’s measure for production and nonsupervisory employees, the closest proxy for frontline workers, runs closer to zero than the all-employee average in most 2026 months, which means the squeeze lands hardest on workers with the least financial cushion.
Debt is amplifying the strain for households already stretched thin, a pattern FACT AND VIEW has traced in detail elsewhere. Total U.S. household debt sat at $18.8 trillion in the second quarter of 2026, with credit card balances at $1.263 trillion, according to the New York Fed. The share of credit card balances more than 90 days delinquent climbed to 12.9%, up from 12.2% a year earlier, the highest level since the aftermath of the 2008 financial crisis. Carrying a balance at today’s typical rates, above 21%, turns a temporary price shock into a longer-running drain on monthly budgets.
Anyone shopping for a home or renewing a loan faces a second squeeze layered on top of the wage story. The average 30-year mortgage rate has climbed back above 7%, roughly a full percentage point higher than a year ago, raising the ongoing cost of homeownership even for a household whose paycheck is holding steady.
What Could Happen Next
The Fed’s own projections, released alongside September’s rate decision, point to inflation staying above target for a while. Officials’ median forecast puts headline PCE inflation, the Fed’s preferred gauge, at 3.7% for 2026, and does not see either headline or core inflation back at 2% until 2029. The Fed’s statement left room for at least one more rate increase before year-end if price pressures do not ease.
If that forecast holds, nominal wage growth will need to climb back above inflation for real pay to recover, and there is no guarantee it will, especially if a cooler labor market keeps raises modest. Some economists have begun invoking the word stagflation, a combination of sticky inflation and slowing growth, though that comparison remains contested. Others argue the current slowdown looks more like a normal, if uncomfortable, cooling after several unusually hot years than a 1970s-style spiral.
A more optimistic path exists too. If tariff-driven price increases finish working through the system and energy prices stabilize once the current geopolitical pressure eases, inflation could drift back toward 3% or below while wage growth holds near its current pace. That combination would let real wages turn positive again without the Fed needing to raise rates further.
Which path plays out will show up first in the data, not in any single speech or headline.
What to Watch
A short list of releases will show which direction this is heading before most commentary catches up.
- The monthly CPI report from the Bureau of Labor Statistics, due roughly mid-month, for whether headline inflation holds near 3.4% or moves further from it.
- The BLS Real Earnings release, published alongside CPI, for the actual real-wage figure rather than the nominal number that tends to dominate headlines.
- The Atlanta Fed’s Wage Growth Tracker, updated monthly, for whether the job-switcher premium over job-stayers widens or narrows.
- FOMC meetings, the next in late October, for whether the Fed follows through on the additional rate increase it signaled in September.
The Bottom Line
Two true things are happening at once. The most recent full year on record, 2025, delivered the highest median household income the Census Bureau has ever measured. The most recent months on record, spring and summer 2026, have delivered real hourly wage declines, as tariffs, an energy price spike and a Fed back in rate-hiking mode outpaced a labor market that has lost some of its leverage. It is one more example of how a healthy-looking economy and a squeezed household budget can coexist.
For a household judging its own situation, the honest answer depends on the measure and the moment. The paycheck is not currently outrunning prices, after a stretch when it was. What remains unresolved is how long this phase lasts, and that will hinge on inflation data and Fed decisions still to come, not on any one report already in hand.
Sources
- U.S. Bureau of Labor Statistics — Consumer Price Index News Release, August 2026
- U.S. Bureau of Labor Statistics — Real Earnings News Release, August 2026
- U.S. Bureau of Labor Statistics — The Employment Situation, August 2026
- U.S. Census Bureau — Income in the United States: 2025 (Report P60-289)
- U.S. Census Bureau — Median Household Income in 2025 Surpassed Previous Highs
- Federal Reserve Bank of Atlanta — Wage Growth Tracker
- Federal Reserve Bank of New York — Quarterly Report on Household Debt and Credit, Q2 2026
- Federal Reserve Bank of New York, Liberty Street Economics — How Fast Do Tariffs Pass Through into Consumer Prices?
- Federal Reserve — September 16, 2026 FOMC Statement and Summary of Economic Projections