Why Everyday Expenses Are Pushing More Americans Toward Credit Cards
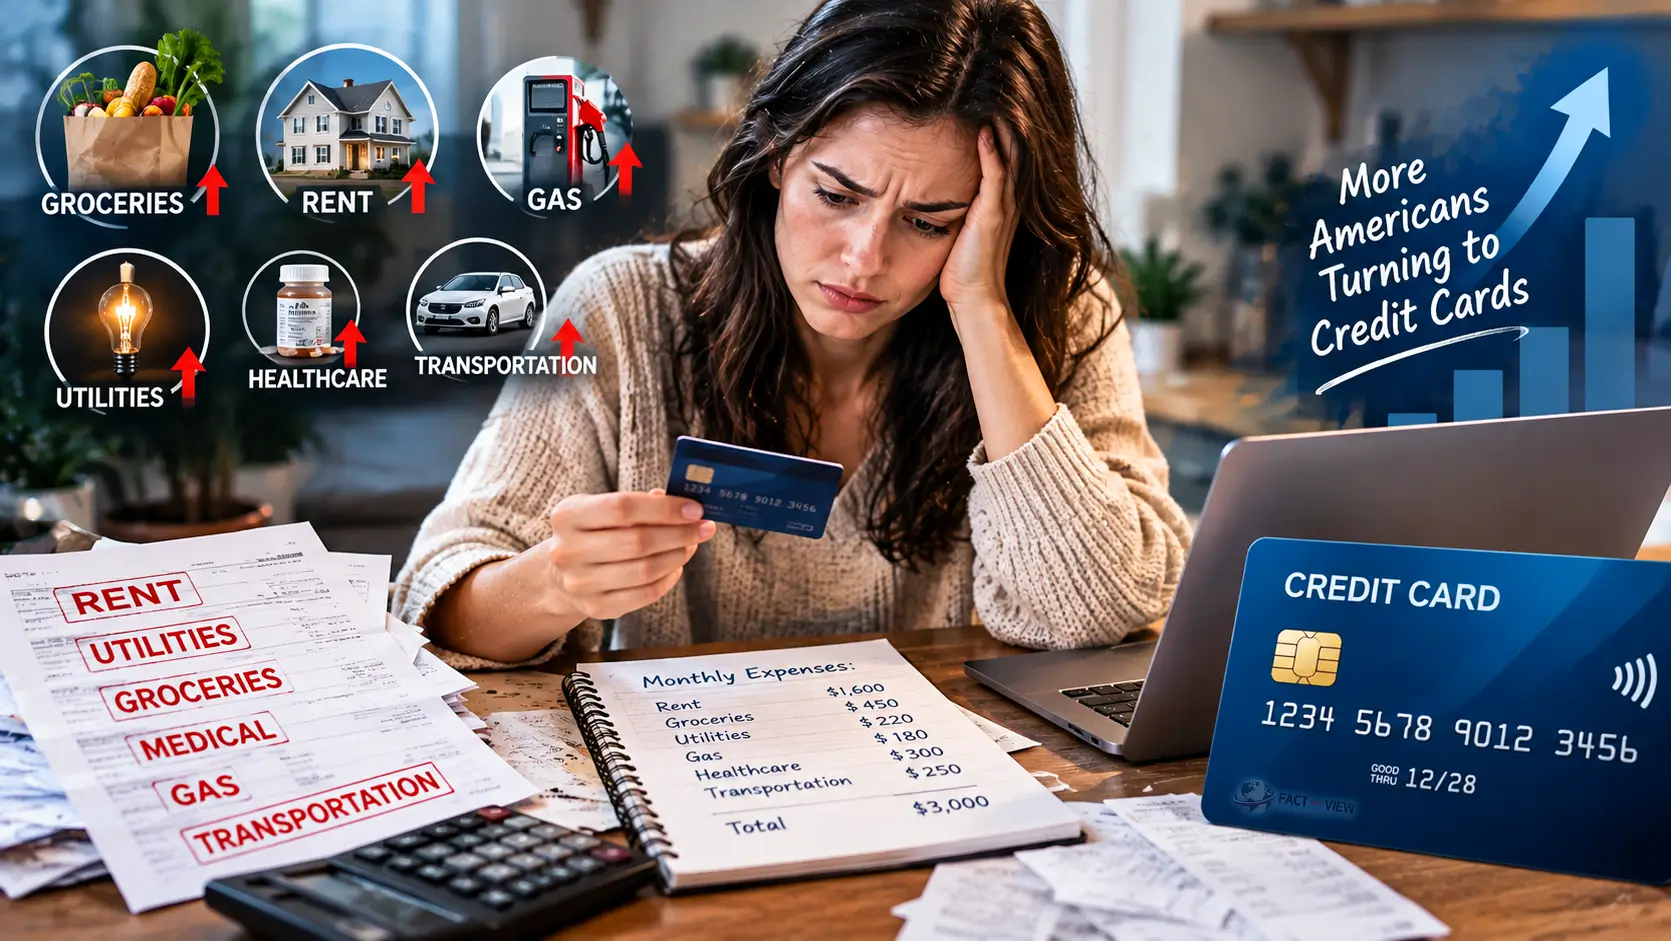
Credit cards used to be for emergencies, big purchases, or the convenience of not carrying cash. For a growing number of Americans, they’ve become something closer to a monthly budget patch.
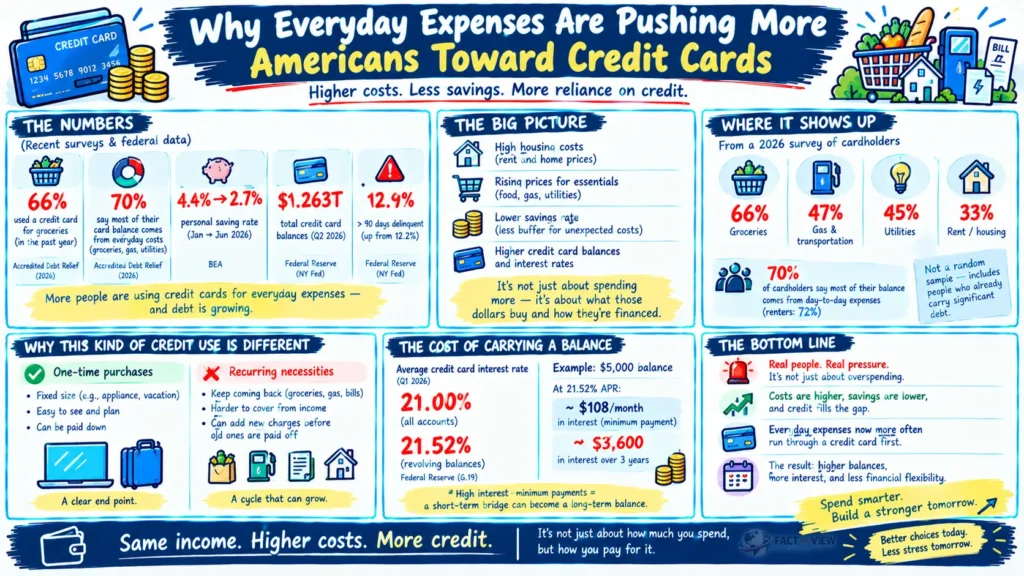
Among Americans already carrying at least $10,000 in unsecured debt, 66% say they used a credit card to pay for groceries in the past year, more than any other everyday expense, according to a 2026 survey from Accredited Debt Relief. A separate survey from the same firm found 70% of people carrying card debt say most of their balance came from ordinary costs like groceries, gas, and utilities, not big one-time purchases.
That shift shows up in the federal data too. Credit card balances and delinquencies are both climbing, and the national savings cushion that used to absorb a rough month has been shrinking for most of 2026. Here’s how a short-term bridge turns into a long-term balance, and why that happens to some households much faster than others.
Credit Cards as a Budget Gap-Filler
The survey data describes a pattern, not an isolated habit.
In the Accredited Debt Relief survey, conducted by Atomik Research among 2,000 U.S. adults carrying significant unsecured debt, 66% had charged groceries to a credit card in the past year. Another 47% had charged gas or transportation, 45% utilities, and 33% rent or housing costs.
A second, separate survey of cardholders by Drive Research reinforced the pattern from a different angle: 70% of respondents said the majority of their current credit card balance came from day-to-day expenses rather than overspending or large purchases. Among renters specifically, that figure rose to 72%, the highest of any group the survey measured.
It’s worth being precise about what these numbers do and don’t show. Both surveys sampled people who already carry meaningful unsecured debt, not a random cross-section of all American cardholders. They describe how debt-carrying households are using credit, not what share of all Americans do. Still, taken together with the federal data below, they point in a consistent direction.
The Numbers Behind the Shift
Two trends from government data help explain why more households are leaning on credit for routine costs.
First, the personal saving rate has been falling through 2026. According to the Bureau of Economic Analysis, Americans saved about 4.4% of disposable income in January 2026; by June, that had dropped to 2.7%. Both figures sit well below the long-run average saving rate of roughly 8%. A thinner savings cushion means less room to absorb a surprise bill without borrowing.
Second, credit card debt and delinquencies are both rising. Total U.S. credit card balances reached $1.263 trillion in the second quarter of 2026, according to the Federal Reserve Bank of New York. The share of card balances more than 90 days delinquent climbed to 12.9%, up from 12.2% a year earlier and the highest level since the aftermath of the 2008 financial crisis.
How many Americans live “paycheck to paycheck” is genuinely disputed, and estimates vary by a wide margin depending on how the question is asked. Surveys from LendingClub have put the figure near 60%, while Bankrate has found a narrower 34%, and the Federal Reserve’s own Survey of Household Economics and Decisionmaking found 54% of adults could cover three months of expenses from savings. Analysts generally agree the honest answer depends heavily on definition, but the direction across nearly every version of the question points the same way: a large share of households have little financial slack.
Why This Kind of Credit Use Is Different
Not all credit card use carries a cost. Nearly half of cardholders pay their balance in full every month and never pay a cent of interest, according to Federal Reserve survey data. For them, a credit card is simply a payment method.
The pattern described above is different in a specific way. A one-time purchase on a credit card, a new appliance or a vacation, has a fixed size. A household can see the balance, make a plan, and pay it down.
Using a credit card to cover recurring necessities works differently, because the expense doesn’t stop. Groceries, gas, and utility bills show up again next month, and if a household couldn’t cover them from income this month, there’s a good chance the same gap reappears next month too. Each new billing cycle can add fresh charges before the previous ones are paid off, so the balance can grow quietly even without any single large purchase.
That’s the mechanism behind why Americans are spending more even as money feels tight: it isn’t necessarily that spending habits have changed, but that the same spending now more often runs through a credit card first.
How a Short-Term Bridge Becomes a Long-Term Balance
This is where interest rates and minimum payments turn a temporary gap into a lasting debt.
The average credit card interest rate was 21.00% across all accounts in the first quarter of 2026, according to the Federal Reserve’s G.19 Consumer Credit release, and 21.52% for accounts that actually carry a balance month to month. That’s down slightly from a late-2023 peak above 22%, but still far above the roughly 16% to 17% average cardholders paid before the Federal Reserve’s 2022 rate hikes. Card rates track the prime rate closely on the way up, but issuers have generally been slower to pass along the Fed’s more recent rate cuts.
Minimum payments compound the problem. Card issuers are required to show cardholders exactly what paying only the minimum will cost. In one real example from a Consumer Financial Protection Bureau model disclosure, a $1,784.53 balance with a $53 minimum payment would take about 10 years to pay off and cost $3,284 in total payments if no new charges were added. Paying just $9 more a month, $62 instead of $53, would cut that to 3 years and $2,232 total, a savings of over $1,000.
Now add new charges to that balance every month, which is exactly what happens when groceries or utility bills get charged to a card that’s already carrying debt. The minimum payment calculation resets slightly higher each time, but it rarely keeps pace with what’s being added, so the balance can drift upward indefinitely rather than shrinking toward zero.
Unexpected costs are often what turns a manageable balance into an unmanageable one. A medical bill, a major car repair, or a reduction in hours at work doesn’t need to be large to matter; it just needs to land on a household that was already using credit to cover the basics, with little savings left to absorb the hit.
Who’s Most Exposed
The households with the least financial cushion tend to be the ones leaning on credit the most.
Renters show up disproportionately in the survey data, more likely than any other group measured to say everyday expenses were the main driver of their credit card balance. Renters typically carry less home equity and fewer accumulated assets than homeowners, which usually means a smaller financial buffer when a bill arrives.
Households with little or no emergency savings face the same dynamic structurally, even without appearing in any specific survey. If income and savings can’t cover this month’s bills, a credit card becomes the default option, and the broader gap between falling inflation and financial strain means that gap hasn’t closed just because headline inflation has cooled from its 2022 peak.
What Could Change
A few developments could ease the pressure, though none is guaranteed to.
If the Federal Reserve continues cutting interest rates, credit card APRs should eventually follow, though historically that pass-through has been slower on the way down than issuers’ pass-through was on the way up. In January 2026, President Trump called for capping credit card interest rates at 10%, a proposal that would require congressional action and has not been enacted. Supporters argue a cap would meaningfully lower the cost of carrying a balance; critics, including many in the banking industry, argue a hard cap could push issuers to restrict credit access for higher-risk borrowers instead.
If the personal saving rate recovers, either through slower price growth, stronger wage growth, or both, households would have more of a buffer before needing to reach for a credit card. If it continues falling instead, the current pattern is more likely to persist or deepen.
What to Watch
A few releases will show whether this trend is easing or deepening before it shows up in next year’s headlines.
- The New York Fed’s Quarterly Report on Household Debt and Credit, for credit card balances and delinquency rates.
- The Federal Reserve’s G.19 Consumer Credit release, for average APRs on new and existing accounts.
- BEA’s monthly Personal Income and Outlays report, for the personal saving rate.
- The Federal Reserve’s annual Survey of Household Economics and Decisionmaking, for a more detailed, government-sourced look at how households are actually covering routine expenses.
The Bottom Line
Using a credit card to cover groceries or a utility bill once in a while isn’t, by itself, a sign of financial trouble. The concern is what happens when it becomes routine: a declining savings rate leaves less of a cushion, interest rates near 21% make any carried balance expensive, and minimum payments are structured to stretch repayment over years rather than months.
What remains genuinely uncertain is how many households are using credit cards this way as a temporary bridge versus a long-term pattern, since the clearest data on the subject comes from surveys of people who already carry debt, not the population as a whole. What the federal data does show clearly is the backdrop: less savings, more carried debt, and interest rates that turn a short-term gap into an expensive one if it isn’t closed quickly.
Sources :
- Accredited Debt Relief / Atomik Research — 2026 Everyday Debt Survey (May 2026)
- Accredited Debt Relief / Drive Research — 2026 Debt Impact Survey (June 2026)
- Federal Reserve Bank of New York — Quarterly Report on Household Debt and Credit, Q2 2026
- Federal Reserve — G.19 Consumer Credit Release
- U.S. Bureau of Economic Analysis — Personal Saving Rate, Personal Income and Outlays
- Consumer Financial Protection Bureau — Minimum Payment Disclosure Model Form G-18(D)
- Federal Reserve — Survey of Household Economics and Decisionmaking (SHED)
- LendingClub, Bankrate — paycheck-to-paycheck survey data (cited for range of estimates, not as a single authoritative figure)