
In 1960, the median American home cost approximately 2.2 times the median household income. A young couple on a single factory wage could save for a down payment in two to three years and own a home by 30. In 2026, the median home costs 5.0 to 7.0 times median household income nationally — and 8 to 12 times in coastal metropolitan areas. The share of Americans who are both married and own a home at age 30 has collapsed from 52% in 1960 to 12% in 2025.
This is not a generational attitude problem. Millennials are not choosing avocado toast over down payments. They are navigating a housing market that has structurally locked out a generation through a combination of monetary policy decisions, supply failures, demographic bad timing, and a wealth transfer dynamic that has made things dramatically easier for every generation that got there first.
The data is unambiguous. The causes are identifiable. And the consequences extend far beyond personal frustration — they are reshaping the macroeconomy, the wealth distribution, and the political landscape of the United States.
The Big Picture: The Numbers That Define the Crisis
The scale of millennial housing exclusion is not anecdotal. It is documented across every major data source tracking housing affordability.
Fact: In 2025, the share of first-time home buyers plummeted to a record low of 21%, while the typical age of first-time buyers climbed to an all-time high of 40 years, according to the National Association of Realtors’ 2025 Profile of Home Buyers and Sellers, per Fortune’s November 2025 analysis. NAR Chief Economist Jessica Lautz described the market as “starved for affordable inventory.”
Fact: IPX1031’s February 2026 national homeownership survey found that 62% of Americans say buying a home in 2026 is unrealistic — up sharply from 49% in 2025. Only 36% believe they can currently afford to buy. When broken down by generation, 82% of Gen Z and 62% of millennials say they cannot afford to buy a home this year, per IPX1031’s 2026 Homeownership Statistics report.
Fact: NAHB’s February 2026 housing affordability analysis finds that 65% of US households cannot afford a median-priced new home in 2026. At a median new home price of $413,595 and a 30-year mortgage rate of 6%, approximately 88.2 million households are priced out of the market. A $1,000 increase in home price raises the required minimum annual income by nearly $300, per NAHB’s Eye on Housing.
The View: These numbers mark a structural break, not a cyclical dip. The average first-time buyer age of 40 means the typical millennial is not buying their first home until they are deep into their adult life — well past the point where equity accumulation delivers maximum benefit. The compounding effect is devastating: a homebuyer at 25 who builds equity for 40 years accumulates dramatically more wealth than one who starts at 40. The generation-wide delay in homeownership is creating a generation-wide wealth gap that will persist for decades.
Related reading: Will Housing Prices Drop in 2026? US Market Analysis — the full 2026 price trajectory and regional breakdown of where affordability is worst.
Deep Dive: Six Structural Causes — None of Which Are Individual Behavior
1. The Mortgage Rate Shock: From 3% to 6.5% in 24 Months
The single largest factor in the millennial housing affordability collapse is the Federal Reserve’s rate hiking cycle from 2022 to 2023.
Fact: Mortgage rates jumped from approximately 3% in early 2022 to 7% by late 2022. As of May 2026, the 30-year fixed mortgage APR is 6.54%, per Bankrate’s current national survey. The Fed held rates at 3.5%–3.75% at its April 29, 2026 meeting with zero cuts priced in for the rest of 2026.
The monthly payment arithmetic is brutal:
| Loan: $400,000 | Rate | Monthly Payment |
|---|---|---|
| 2021 (boomer refinance era) | 2.75% | $1,633 |
| 2026 (millennial first-time buyer) | 6.54% | $2,546 |
| Difference | — | +$913/month |
Over 30 years, a millennial buying the same $400,000 home today pays approximately $328,680 more in total interest than a boomer who refinanced in 2021. This is not a small lifestyle difference. It is the difference between building wealth and servicing debt.
The View: The rate shock hit millennials with a uniquely cruel timing. Boomers and older Gen X refinanced their mortgages at generational lows in 2020–2021 — locking in 2.5%–3.0% rates for 30 years. When rates doubled, those owners had no incentive to sell (the lock-in effect), removing supply from the market simultaneously with the demand shock that higher rates created. Millennials arrived at the housing market in prime buying years and walked into the worst affordability conditions since the early 1980s.
Related reading: Interest Rates Explained: How They Affect Your Money in 2026 — the mechanics of how the Fed’s rate decisions translate directly into monthly mortgage payments.
2. The Lock-In Effect: Boomers Aren’t Selling
The housing supply shortage is not a natural phenomenon. It is a direct consequence of the incentive structure created by low fixed-rate mortgages.
Fact: More than 54% of boomers say they never plan to sell their home, per Clever Real Estate’s survey cited in GOBankingRates’ 2026 millennial homeownership analysis. Approximately 40% of all US homes have no mortgage at all — Deutsche Bank analysis shows 46% of homes are owned outright with no debt. These owners have zero financial pressure to sell, and massive financial disincentive to trade a paid-off or 2.75%-rate home for a purchase at 6.5%.
Fact: When boomers do sell, they typically downsize — competing directly with millennials for starter homes. Boomer offers are frequently more attractive: they can use equity proceeds for cash offers or large down payments, outcompeting first-time buyers who need conforming loans.
The View: The intergenerational competition for the same housing stock is not a cultural conflict — it is a structural market failure produced by a 30-year wealth accumulation gap. A boomer who bought a $200,000 home in 1995 now owns a $600,000+ asset that appreciated 200–300% while also paying off the mortgage. A millennial buying their first home in 2026 starts from zero equity, pays 6.5% on a loan larger than the total value of their parents’ first home. These are not equivalent market positions.
3. The Down Payment Trap: Saving While Renting at $2,000+/Month
The down payment requirement is the least-discussed but most practically devastating barrier.
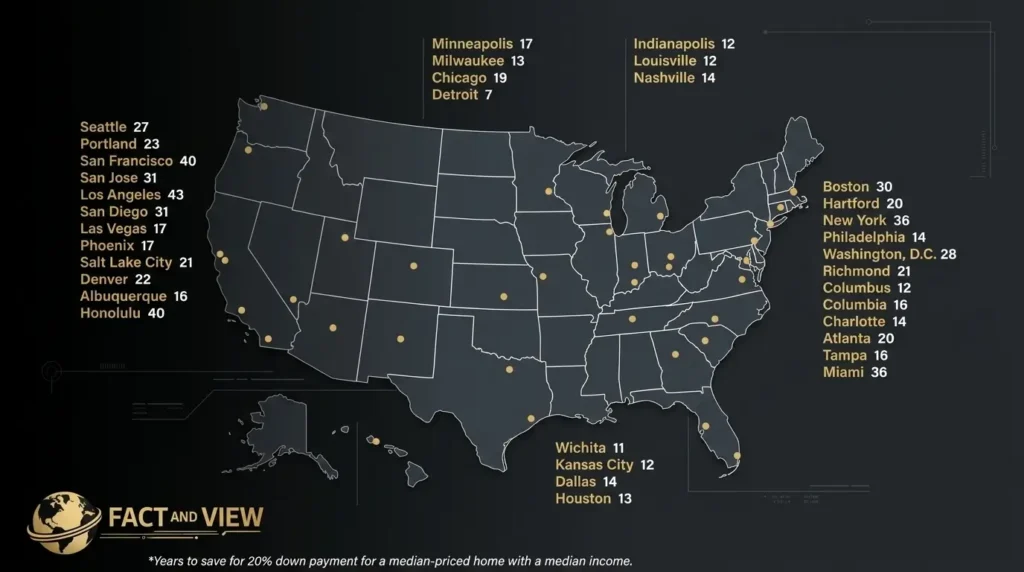
Fact: A conventional 20% down payment on the $413,595 median new home price requires $82,719 in cash savings — before closing costs of approximately $8,000–$12,000. For a millennial earning the median US household income of $80,000, saving $82,719 while paying median rent of approximately $2,000/month leaves precious little room for savings accumulation.
Fact: Redfin and Zillow data shows that median U.S. rents in 2025 rose to approximately $2,000 per month for a two-bedroom unit nationally — with coastal metros averaging $3,000–$4,000+. A household spending $24,000/year on rent while trying to save $82,000 for a down payment needs approximately 3.5–4 years of zero non-essential spending — no car replacements, no medical bills, no student loan setbacks.
The View: Student loan debt compounds the down payment problem in a way that is specific to millennials. The cohort that entered the workforce during and after the 2008 financial crisis — a period of high unemployment, wage suppression, and record student loan balances — started the savings race years behind every previous generation. Many millennials spent their prime savings years (25–35) in a rentals-student-loans-low-wages environment that made capital accumulation nearly impossible.
4. Zoning and Supply: The Local Government Supply Failure
Housing is a supply-demand market. Decades of restrictive zoning in the most economically productive metropolitan areas have created an artificial supply constraint that no rate cut can solve.
Fact: Single-family zoning laws — which prohibit apartment buildings and higher-density housing in most residential neighborhoods across major U.S. metros — cover approximately 75% of residential land in cities like Los Angeles, San Jose, and Seattle. New housing permits in these cities have consistently failed to keep pace with population and job growth for decades.
Fact: The NAHB estimates that regulatory costs account for approximately 24% of the price of a new single-family home — approximately $93,870 per home in regulatory and land use compliance costs at current median prices. These costs are not optional — they are embedded in every new home price nationally.
The View: Zoning is where the housing crisis becomes a governance failure. The homeowners who benefit from supply restriction — those who already own homes in well-located neighborhoods — are also the most politically active constituency at local elections. They show up to zoning board meetings. Renters and aspiring buyers don’t. The result is a systematic policy bias toward restricting supply that benefits current owners at the expense of future ones. This is not market failure. It is democratic failure — and it is one reason why the Independent Center’s 2025 analysis notes that “neither major political party is prioritizing this issue” despite millennials and Gen Z becoming the largest voting bloc.
5. The Wealth Transfer Machine: Inheritance Is the New Down Payment
For a significant portion of millennial homebuyers, the down payment is not being saved — it is being received.
Fact: According to AEI housing data and supporting Census Bureau analysis, the homeownership gap between income tiers has widened significantly. Only 25% of families earning $50,000–$75,000 owned homes as of recent data — versus 70–80% of households earning $175,000+. The families at the top have equity and inheritance capital to pass down; those at the bottom do not.
Fact: 46% of all US homes have no mortgage, concentrated among older owners who have paid off their debt over decades. These owners’ assets will eventually transfer — but Baby Boomer intergenerational wealth transfers are concentrated in the top income quintile, where inheritance amounts are large enough to fund meaningful down payments in high-cost markets.
The View: The US housing market in 2026 increasingly operates as a two-track system: those with parental wealth access can buy; those without it rent indefinitely. This is not a meritocratic outcome — it is a wealth inheritance dynamic that is accelerating the concentration of the most reliable wealth-building asset (homeownership) among those who are already wealthy. The macroeconomic consequence is a permanent widening of the wealth gap, with compounding effects over decades as those who own homes build equity and those who rent do not.
6. The Macroeconomic Consequence: A Nation of Renters Is a Poorer Nation
Housing is not just shelter. It is the primary wealth-building mechanism for American middle-class households.
Fact: The Federal Reserve’s Survey of Consumer Finances consistently shows that median homeowner net worth is approximately 40x higher than median renter net worth. In 2022 (most recent SCF data), median homeowner net worth was $396,200 versus $10,400 for renters — a 38:1 gap. As the share of millennials who own homes declines, the generation-wide wealth accumulation trajectory falls well below every preceding generation.
The View: A generation that rents instead of owns does not just have lower wealth at 65. It has lower consumption capacity throughout its working life (rent takes more income than mortgage payments on the same property over time), lower retirement security (no equity to tap), lower political stability (renters are more mobile, less civically engaged), and lower economic resilience (no asset to borrow against in emergencies). The housing affordability crisis is a retirement savings crisis, a consumption crisis, and a political stability crisis rolled into a single set of numbers.
Related reading: What Happens If Social Security Runs Out? — why Social Security solvency matters more for the generation locked out of homeownership than for any other cohort.
Risks & Opportunities: Three Housing Scenarios for Millennials
Base Case (~45% probability): Slow Reset, Marginal Improvement
Mortgage rates ease toward 5.75%–6.0% by late 2027 as inflation declines and the Fed cuts once or twice. Inventory rises 10–15% nationally. Home price growth slows to 0–2%. Affordability improves modestly — the required income to qualify for the median home falls by approximately $5,000–$8,000.
What this means for you: Marginal improvement is not transformative. The first-time buyer age of 40 stays near 38–39. Down payment requirements remain massive relative to income. The fundamental structural causes — zoning, lock-in effect, wealth concentration — are unresolved.
Upside Scenario (~25% probability): Rate Drop + Supply Reform
Iran diplomatic resolution drives oil prices down, pulling inflation below 2.5%. The Fed delivers two cuts in 2026. Mortgage rates fall to 5.25%–5.5%. Several major cities adopt zoning reform (Minneapolis, Austin, Denver models), adding meaningful supply. First-time buyer accessibility improves significantly in 2027.
What this means for you: If you are waiting to buy, 2027 may be the best entry window of the decade. Use the 2026 period to maximize savings, improve credit score, and get mortgage pre-approval so you can move quickly when rates drop.
Downside Scenario (~30% probability): Stagflation Deepens, Affordability Worsens
Middle East conflict escalates. Inflation spikes toward 5%+. Mortgage rates return toward 7.5%–8%. First-time buyer share falls below 20%. Millennial homeownership rate at 35 drops further below 56%.
What this means for you: This scenario extends the generational rental trap indefinitely for many millennials. Financial planning must account for a renting lifetime: maximize Roth IRA and 401(k) contributions aggressively, since the wealth-building function of homeownership must be replaced entirely by financial market investments.
Related reading: How Beginners Should Invest in 2026 — building the financial portfolio that compensates for delayed homeownership.
The Bottom Line
The millennial housing crisis is not going to be solved by lower avocado toast consumption. It requires structural changes — in monetary policy, in zoning law, in the tax treatment of housing investment, and in the inherited wealth dynamics that are determining who gets to own and who doesn’t.
If you are a millennial trying to buy:
- Do the math at current rates, not hoped-for future rates. At 6.5%, know your exact qualifying income, maximum loan, and required down payment for your target market using the CFPB’s mortgage calculator
- Consider markets with falling inventory. Sun Belt cities with rising inventory — Austin, Phoenix, Tampa — are offering price reductions and negotiating leverage that coastal markets are not. Redfin’s market tracker at redfin.com/us-housing-market shows days-on-market and offer competition data by ZIP code
- If you can’t buy yet, invest the difference. A renter who invests $913/month (the mortgage payment gap vs. 2021) into index funds at 8% average return builds approximately $1.1 million over 30 years — comparable to home equity accumulation in many markets
If you already own:
- The lock-in effect is costing you in hidden ways — reduced mobility, inflexibility on job opportunities, and lifestyle constraints that have real economic value. Model the true cost of staying vs. selling across both rate scenarios
For policymakers and businesses:
- The declining millennial homeownership rate is not just a social problem — it is a consumer spending problem, a retirement savings problem, and a long-run macroeconomic drag that shows up in every GDP forecast
The data says millennials are not failing the housing market. The housing market is failing millennials.
FAQ
Why can’t millennials afford to buy homes in 2026?
Six structural forces are compounding simultaneously: (1) mortgage rates at 6.5% vs. 3% in 2021, raising monthly payments by $913+ on a $400,000 loan; (2) home prices at 5–7x median income nationally vs. 2.2x in 1960; (3) the lock-in effect keeping boomers with 3% mortgages from selling; (4) down payment requirements of $80,000+ that take years to save while paying $2,000/month in rent; (5) restrictive zoning keeping housing supply artificially constrained; and (6) concentrated wealth inheritance advantages that help high-income families but not middle-income ones. These are structural, not behavioral, causes.
What percentage of millennials own homes in 2026?
At age 35, 56% of millennials owned homes in 2024 — compared to 59.4% of Gen X and 61.5% of Baby Boomers at that same age, per Redfin’s generational homeownership analysis. More broadly, IPX1031’s 2026 survey found 62% of millennials say they cannot afford to buy a home this year. The NAR’s 2025 data showed first-time buyer share hitting a record low of 21% with the median first-time buyer age at an all-time high of 40 years — a stark indicator of how far back in the life cycle purchase decisions have been pushed.
How much does a millennial need to earn to afford a median-priced home in 2026?
At the national median new home price of $413,595 with a 30-year mortgage at 6%, the required minimum household income is approximately $100,000–$110,000 annually, per NAHB’s February 2026 affordability analysis. In high-cost coastal metros — where median prices are $700,000–$1.5 million — the required income climbs to $150,000–$350,000. Only approximately 35% of US households earn $100,000+, which means the median home is structurally inaccessible to the majority of American households at current prices and rates.
How does the mortgage lock-in effect hurt millennial homebuyers?
The lock-in effect occurs when existing homeowners — primarily Baby Boomers who refinanced at 2.5%–3.0% in 2020–2021 — have no financial incentive to sell because doing so would require them to purchase their next home at 6.5%+. With 54% of boomers saying they never plan to sell and 40%+ of homes owned outright with no mortgage, the resale market is starved of inventory. Fewer homes for sale means higher prices for the limited supply available. Millennials competing for a shrinking pool of homes face both elevated prices and elevated rates simultaneously.
Is it better for millennials to buy or rent in 2026?
At current prices and rates, renting is mathematically cheaper than buying in most major US metros — the “rent vs. buy” calculator typically shows renting advantaged by $400–$800/month. But that analysis misses the long-run wealth accumulation benefit of ownership. The correct framework: if you plan to stay in one place for 7+ years, buying still builds more wealth than renting in most markets. If your horizon is shorter, rent and invest the payment difference aggressively. Use NYT’s Rent vs. Buy Calculator to model your specific situation, and Redfin’s Market Tracker to identify markets where prices are softening.
Which housing markets are most accessible for first-time buyers in 2026?
Markets with rising inventory, falling prices, and lower price-to-income ratios offer the best first-time buyer entry conditions in 2026. Based on Realtor.com and Redfin data:
- Midwest metros: Columbus (OH), Indianapolis, Kansas City, St. Louis — median prices $200,000–$320,000 with reasonable income ratios
- Sun Belt with oversupply: Austin (TX), Phoenix (AZ), Tampa (FL) — inventory rising significantly, motivated sellers, price reductions 3–7%
- Secondary Southeast: Raleigh (NC), Huntsville (AL), Jacksonville (FL) — strong job growth, lower price pressure than primary Sun Belt cities
Avoid: coastal California, New York Metro, Boston, and Seattle — where price-to-income ratios of 10–15x make ownership mathematically inaccessible for anyone without inherited capital.
Where can I track housing affordability data in real time?
Primary sources for monitoring affordability conditions:
- NAHB Eye on Housing — monthly housing affordability and priced-out analysis
- NAR Housing Statistics — first-time buyer share, median buyer age, and market conditions
- Redfin Housing Market Tracker — real-time days on market, price reductions, and inventory by metro
- Freddie Mac PMMS — definitive weekly 30-year mortgage rate benchmark
- CFPB Mortgage Calculator — model your specific payment at current and projected rates
- IPX1031 Homeownership Statistics — annual survey of generational homeownership attitudes and barriers
Sources: Fortune — Housing Affordability Crisis April 22, 2026 · Fortune — First-Time Buyers Record Low November 2025 · IPX1031 — 2026 Homeownership Statistics, February 2026 · NAHB Eye on Housing — Affordability February 2026 · Wealthvieu — Homeownership Rate by Demographics 2026 · Newsweek — Gen Z Housing Problem · NMP — Gen Z and Millennials Locked Out · GOBankingRates — Millennials Can’t Afford Homes · Independent Center — Why Homeownership Feels Impossible · Bankrate Mortgage Rates May 2026
© Fact and View, 2026. For informational purposes only. Not financial advice.


Be First to Comment