
The Congressional Budget Office updated its Social Security projection in February 2026 and moved the trust fund depletion date to 2032 — one year earlier than last year’s estimate. At that point, the CBO projects an immediate across-the-board benefit cut of 28% for every current and future recipient. Not a hypothetical. Not a political talking point. A legally mandated automatic reduction that happens the moment the trust fund balance hits zero, unless Congress acts first.
As of April 2026, the average Social Security monthly check for a retired worker is $2,081. A 28% cut reduces that to approximately $1,498 per month — a $583 monthly reduction on a fixed income, in an economy where CPI is running at 3.3% and grocery prices are 31% above 2020 levels.
That is the scenario you are now six years away from — and it is arriving faster than any previous estimate predicted.
The Big Picture: Why the Timeline Keeps Moving Earlier
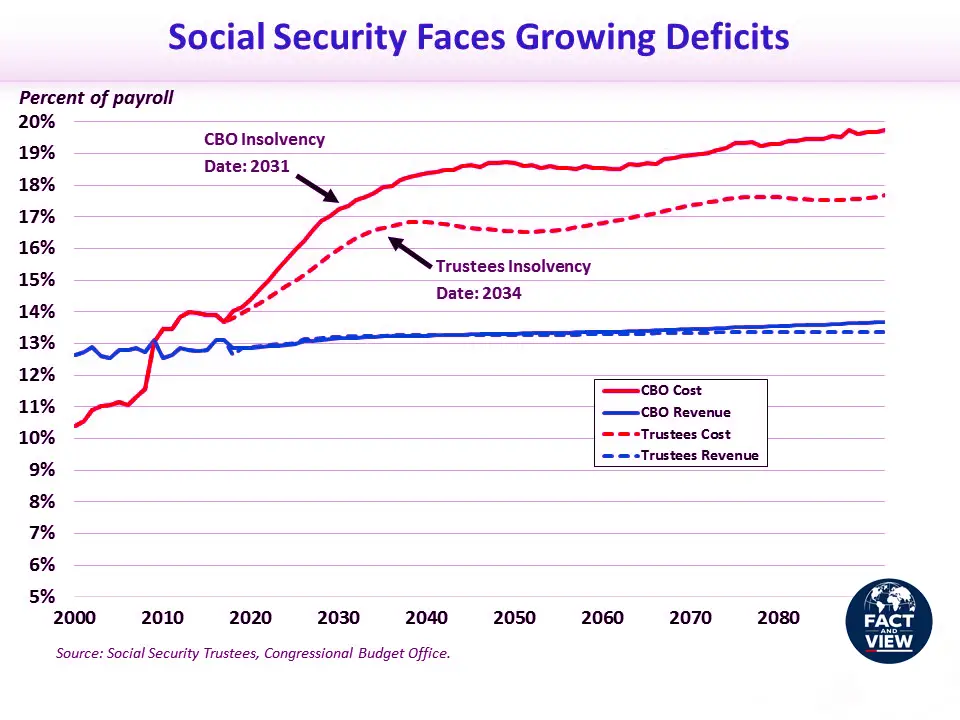
Social Security was not designed to run a deficit. For most of its 90-year history, it ran surpluses — collecting more in payroll taxes than it paid in benefits, building reserves in the Trust Fund. That surplus era ended in 2021. The program has run cash deficits every year since, drawing down reserves that are now projected to hit zero in less than a decade.
Fact: The 2025 Social Security Trustees Report (released June 2025) projects OASI Trust Fund depletion in 2033, with a resulting 23% automatic benefit cut. The February 2026 CBO update pushed that date forward to 2032, with the automatic cut rising to 28% — five percentage points higher than the Trustees projected. Per Kiplinger’s April 2026 analysis, CBO cited three primary drivers of the accelerating timeline:
- The 2025 Reconciliation Act (OBBBA) — the senior deduction provision reduces revenue flowing to the Trust Fund
- Higher Medicare spending — above-expected Part A costs in 2025 and increased Medicare Advantage costs in 2026 are pulling the combined fund timeline forward
- Demographic acceleration — a more rapidly aging population and slower growth in the number of payroll-tax-paying workers than previously modeled
Fact: The 2025 Social Security Fairness Act, signed earlier in 2025, extended benefits to approximately 3 million former public-sector workers — teachers, police officers, and firefighters previously excluded from full benefit calculation — adding nearly $200 billion in additional obligations over a decade. This single law pulled the depletion date forward by approximately one year.
Fact: Over the next decade (2026–2035), Social Security will run $3.6 trillion in cumulative cash-flow deficits — equal to 2.68% of taxable payroll or 0.95% of GDP annually, per the American Action Forum’s December 2025 analysis of the Trustees’ projections.
The View: Every time the depletion date moves earlier — and it has moved earlier in every report since 2019 — the cost of a solution increases. The American Action Forum calculates that restoring long-term Social Security solvency today requires either a 29% payroll tax increase or a 22% across-the-board benefit cut. Waiting until 2034 raises those requirements to a 34% payroll tax increase or a 26% benefit cut. The arithmetic is not complicated. Every year without action adds to the eventual adjustment. What is complicated is the politics — and in 2026, with a $39 trillion national debt and a Congress focused on midterm elections, the political will for either tax increases or benefit cuts is essentially absent.
Related reading: US National Debt Explained: Should You Be Worried? — Social Security’s $3.6 trillion decade deficit is embedded in the same fiscal trajectory that is pushing the national debt toward 175% of GDP by 2056.
Deep Dive: What Actually Happens When the Trust Fund Hits Zero
1. Benefits Don’t Stop — They Are Automatically Cut
The most important misconception about Social Security solvency is that depletion means bankruptcy. It does not. Social Security continues operating indefinitely from ongoing payroll tax revenue.
Fact: Social Security will keep paying benefits from incoming payroll tax revenue after trust fund depletion. The shortfall between that ongoing revenue and full scheduled benefits triggers an automatic reduction. Per the CBO’s February 2026 projection, that reduction is 28% starting in 2033. Per the SSA Trustees, it is 23% starting in 2033 (combined OASDI basis of 19% in 2034). The range reflects different methodological assumptions — but all scenarios produce a significant, immediate cut affecting every recipient simultaneously.
Fact: Under the combined OASDI trust fund calculation (OASI + Disability Insurance together), the SSA projects combined depletion in 2034, at which point 81% of scheduled benefits would be payable, declining to 72% by 2099.
What a 23–28% cut means in dollar terms:
- Average retired worker benefit of $2,081/month → $1,498–$1,602 after cut
- Average all-beneficiary benefit of $1,933/month → $1,392–$1,487 after cut
- A couple receiving $4,000/month combined → $2,880–$3,080 after cut
- A widow or widower receiving $1,700/month → $1,224–$1,309 after cut
For households where Social Security represents 50%+ of retirement income — approximately 50% of retirees — this is not a marginal adjustment. It is a fundamental restructuring of their financial security.
2. The Macro Impact: Consumer Spending and the Retirement Economy
Social Security is not just a personal finance issue. It is a macroeconomic stabilizer that channels approximately $1.4 trillion annually into consumer spending — the largest single transfer payment in the federal budget.
Fact: Social Security paid out more than $1.2 trillion in annual benefits as of 2023, reaching approximately 70 million Americans including retirees, survivors, and disabled workers. A 23–28% benefit cut reduces the annual payment flow by approximately $276–$336 billion — equivalent to removing a mid-sized country’s GDP from U.S. consumer spending simultaneously.
The macroeconomic channels through which a benefit cut propagates:
- Retail spending contraction: Retirees spend a higher proportion of income on non-discretionary goods — groceries, healthcare, housing — than the working-age population. A $500/month reduction per household multiplied across 70 million recipients translates directly into lower grocery sales, lower restaurant patronage, lower travel spending
- Healthcare demand shift: Retirees with reduced income reduce discretionary healthcare spending first — dental, vision, elective procedures — while increasing emergency room utilization, which is the most expensive healthcare delivery method
- Housing market impact: Approximately 40% of retirees depend on Social Security for at least 90% of income. Income reduction at this scale would increase foreclosure risk for the significant minority of retirees who carry mortgage debt
- Investment market confidence: A sudden 23–28% cut to the income of 70 million Americans would be one of the largest abrupt demand shocks in modern U.S. economic history, with consumer confidence implications that would ripple into equity and housing markets simultaneously
The View: The financial media tends to frame Social Security solvency as a retirement planning problem — which it is. But it is equally a macroeconomic stability risk of the first order. A $276–$336 billion annual reduction in consumer spending, concentrated among the lowest-mobility population segment (retirees cannot simply return to work at scale), would produce a demand contraction comparable in magnitude to a moderate recession — without any of the normal countercyclical policy tools to offset it.
3. The Three Reform Options — And Why None Are Politically Easy
Congress has three mathematical tools to fix Social Security. Every credible reform plan uses some combination of them.
Option A: Raise the payroll tax rate
- Current rate: 12.4% of wages split evenly between employer and employee (6.2% each)
- Required increase to stabilize solvency today: approximately 29% — meaning the combined rate rises from 12.4% to approximately 16%
- For a worker earning $70,000, this adds approximately $2,520/year in taxes (employer share matches)
Option B: Raise the payroll tax cap
- In 2026, the maximum earnings subject to Social Security tax is $184,500, up from $176,100 in 2025
- Eliminating the cap entirely (taxing all wages) would reduce the 75-year shortfall by approximately 72%, per SSA actuarial estimates
- Politically contentious: shifts burden to upper-income earners who currently pay a lower effective Social Security tax rate as a percentage of total income
Option C: Reduce benefits or raise the retirement age
- Full retirement age is currently 67 for those born after 1960
- Raising it to 68 or 69 would reduce the actuarial deficit significantly but is functionally a benefit cut for workers who cannot physically work until the new age
- Means-testing — reducing benefits for higher-income retirees — reduces costs but undermines Social Security’s universal insurance character
Fact: If policymakers wait until trust fund exhaustion in 2032–2034, the required tax increase is a 34% payroll tax increase or a 26% across-the-board benefit cut — 17% larger adjustments than if reform begins today, per the American Action Forum analysis.
The View: The political calculus that prevents reform is rational at the individual legislator level and irrational at the systemic level. Every member of Congress who avoids the Social Security vote preserves their electoral future while increasing the eventual cost for everyone. This is the classic collective action problem — and it has produced 25+ years of inaction on a problem that has been visible for exactly that long. The 2032 CBO deadline is now within a single Senate term. It is no longer a problem for future Congresses. It is a problem for the Congress sitting in 2027–2028.
4. What DOGE, the OBBBA, and the Current Congress Are Doing About It
Almost nothing structural.
Fact: The OBBBA (One Big Beautiful Bill Act) included no Social Security reform provisions. It explicitly avoided touching Social Security benefits or the payroll tax structure. The DOGE efficiency initiative operates in discretionary spending — Social Security is mandatory spending that continues automatically under current law and is entirely outside DOGE’s scope.
Fact: The Social Security Fairness Act of 2025 moved in the opposite direction — expanding benefits to 3 million additional workers at a cost of nearly $200 billion over ten years, accelerating depletion by approximately one year.
The View: The 118th and 119th Congresses have collectively made Social Security’s solvency problem worse, not better. Expanding benefits without addressing the funding gap is arithmetically equivalent to running faster toward a cliff. The political logic is clear — Social Security recipients are among the most reliable voters in America, and no incumbent wants to be the one who cut their checks. But the math is also clear: each year of delay adds approximately 1.5–2.0 percentage points to the required eventual adjustment.
Related reading: Government Spending Explained: Where Your Tax Dollars Go — Social Security’s $1.4 trillion annual outlay in the context of the full federal budget picture.
Risks & Opportunities: Three Scenarios
Base Case (~50% probability): Muddling Through, Reform in 2030–2031
Political pressure builds as the 2032 CBO deadline approaches. A bipartisan commission — modeled on the 1983 Greenspan Commission that last fixed Social Security — negotiates a package in 2030 or 2031. The fix includes a combination of modest payroll tax increases, gradual retirement age adjustments, and benefit formula changes for higher earners. Benefits are not cut for current recipients.
What this means for you: If you are currently receiving benefits, they are protected. If you are 55–65 and planning on Social Security, model your retirement assuming 15–20% lower benefits than currently projected as a planning margin. If you are under 55, plan Social Security as a supplement to personal savings, not the foundation.
Upside Scenario (~20% probability): Early Bipartisan Reform
The 2026 midterm elections change the political calculus. A bipartisan fiscal deal — forced by bond market pressure on the national debt — includes Social Security reform as a component of a broader deficit reduction package. The solvency problem is resolved for 75 years. Benefits are modestly adjusted for future high earners; the payroll cap is raised.
What this means for you: The most positive outcome for younger workers — certainty about future benefits allows genuine retirement planning. For investors, resolution of this fiscal uncertainty removes a significant tail risk from the long-term fiscal picture, potentially reducing the structural upward pressure on Treasury yields.
Downside Scenario (~30% probability): No Action, Automatic Cuts in 2032–2033
Congress does not act. The trust fund is exhausted on schedule. The legally mandated automatic benefit reduction of 23–28% takes effect. Approximately 70 million Americans experience a simultaneous income shock.
What this means for you: If you are within 10 years of retirement, this is the scenario that makes private savings most critical. An immediate 28% cut on a $2,081 monthly benefit removes $583 permanently — from a fixed income, in a high-inflation environment, with no mechanism for recourse or appeal. The political fallout would be enormous, but the law does not give the SSA discretion to pay more than incoming revenue supports.
Related reading: How Beginners Should Invest in 2026 — building the personal savings base that makes Social Security a supplement rather than a foundation. | Best Investments During Inflation (2026 Guide) — protecting retirement savings against the inflation that is simultaneously eroding Social Security’s purchasing power.
The Bottom Line
Social Security is not going away. But in its current form, it is mathematically unsustainable — and the timeline for a forced adjustment is now six to seven years away, not a generation.
Your action checklist by age group:
If you are 62–70 (at or near retirement age):
- The decision to claim early vs. delay is not about protecting yourself from future cuts — per CNBC’s Select analysis, claiming early provides no advantage if cuts occur after trust fund depletion since cuts apply proportionally to whatever benefit you receive
- Maximize your benefit by delaying to 70 if health and finances allow — the 8% per year delayed credit still applies, and a higher base provides more absolute protection even after a percentage cut
- Diversify income sources now: rental income, dividend stocks, annuities
If you are 45–62 (approaching retirement):
- Model your retirement income with Social Security at 70–77% of your projected benefit (the automatic cut range)
- The Roth IRA and 401(k) contribution maximums for 2026 are $7,500 and $23,500 respectively — maximize them
- Consider Social Security as a bonus, not a foundation; build a savings floor that supports your lifestyle without it
If you are under 45:
- Do not depend on Social Security as a primary retirement income source
- Prioritize tax-advantaged accounts: Roth IRA ($7,500/year), 401(k) ($23,500/year), HSA if eligible
- The compounding math at your age makes starting now worth far more than any Social Security benefit change can remove
Use the official SSA’s my Social Security portal to see your projected benefit, earnings history, and how different claiming ages affect your monthly amount. Then stress-test those projections at 72–80% of face value to understand your real planning range.
The 2032 deadline is not abstract. It is within one presidential term. The time to plan around it is now — not when the headlines confirm what the actuaries have been saying for years.
FAQ
Will Social Security really run out of money?
The Social Security Trust Fund — the reserve account that supplements payroll tax revenue — is projected to be depleted between 2032 and 2034, depending on the projection source. The CBO’s February 2026 update projects 2032; the SSA Trustees’ June 2025 annual report projects 2033 for the OASI fund; the combined OASDI depletion is projected for 2034. After depletion, Social Security does not stop operating — it continues paying from incoming payroll taxes, which are projected to cover 72–77% of scheduled benefits. The gap triggers an automatic proportional reduction. Read the official SSA projection at ssa.gov/oact/trsum.
How much will Social Security benefits be cut if the trust fund runs out?
Depending on which projection you use: the CBO’s February 2026 estimate is a 28% automatic benefit cut starting in 2033; the SSA Trustees project a 23% cut starting in 2033. On a combined OASDI basis (including Disability Insurance), the SSA projects that 81% of scheduled benefits would be payable at depletion in 2034, declining to 72% by 2099. In dollar terms, the average $2,081 monthly retirement benefit would fall to approximately $1,498–$1,602 immediately. Every recipient is affected proportionally — current retirees, near-retirees, and future beneficiaries alike.
What can Congress do to fix Social Security?
Three primary tools exist: raise the payroll tax rate, raise or eliminate the payroll tax earnings cap, or reduce benefits. The American Action Forum estimates that restoring solvency today requires either a 29% payroll tax rate increase (from 12.4% to approximately 16%) or a 22% across-the-board benefit cut. Waiting until 2034 increases those requirements to a 34% tax increase or 26% cut. In practice, every bipartisan reform package since 1983 has combined modest adjustments to all three levers rather than applying the full burden to any single one. The longer Congress waits, the more each lever must move.
Should I claim Social Security early to protect myself from future cuts?
No — claiming early provides no meaningful protection from future benefit cuts. Cuts are applied proportionally to whatever benefit amount you receive, regardless of when you claim. A 28% cut on a reduced early-claim benefit produces a smaller absolute payment than a 28% cut on a full delayed-claim benefit. The claiming-age decision should be based on your health, financial needs, and break-even analysis — not on trying to outrun a cut that has not happened yet. Use the SSA’s my Social Security portal to model your specific scenario.
Does Social Security affect the federal budget and national debt?
Yes — significantly. Social Security is the largest single line item in the federal budget, paying out approximately $1.4 trillion annually. The program will run $3.6 trillion in cumulative cash-flow deficits over 2026–2035, equal to 0.95% of GDP annually. As the Trust Fund depletes, the Treasury must issue additional bonds to cover shortfalls — adding to the $39 trillion national debt. Social Security’s structural imbalance is one of the primary drivers of the long-run fiscal deterioration that the CBO projects will push U.S. debt to 175% of GDP by 2056.
How does Social Security interact with Medicare solvency?
Medicare faces a parallel solvency challenge. The CBO’s April 2026 update also accelerated the Medicare Hospital Insurance (HI) Trust Fund depletion date — the fund that covers Part A hospital services. The same three factors accelerating Social Security depletion (OBBBA provisions, higher healthcare costs, demographic shifts) are also affecting Medicare. For retirees, both programs facing simultaneous solvency pressure represents a compounded income and healthcare cost risk — reduced Social Security income coinciding with potential Medicare benefit cuts or premium increases in the same period.
Where can I track Social Security solvency projections in real time?
Primary sources for monitoring Social Security’s financial status:
- SSA.gov — Annual Trustees Report — official annual projection from the Social Security Board of Trustees, released each June
- CBO — Social Security Budget Outlook — updated projections with economic sensitivity analysis
- PGPF — Social Security Tracker — Peter G. Peterson Foundation’s plain-language tracking of trust fund status
- SSA My Social Security — your personal projected benefit at different claiming ages
- American Action Forum — Social Security Analysis — policy analysis of reform options and their actuarial impact
Sources: CBO — Social Security Trust Fund Depletion 2032, February 2026 · Kiplinger — When Will Social Security Run Out, April 10, 2026 · Boldin — Social Security Benefit Cuts, April 2026 · CNBC Select — Will Social Security Run Out · SSA Trustees Report Summary · AARP — Trust Fund Shortfall 2034, June 2025 · PGPF — Social Security Shortfalls Analysis · American Action Forum — Social Security Trust Funds and Reform, December 2025
© Fact and View, 2026. For informational purposes only. Not financial or retirement planning advice. Consult a qualified financial advisor for guidance specific to your situation.


Be First to Comment