On March 19, 2026, Dubai crude oil hit $166 per barrel — the highest price ever recorded in the history of oil markets. The International Energy Agency called the Strait of Hormuz closure “the greatest global energy security challenge in history.” Brent crude surged 55% from $72 to nearly $120 in less than four weeks — one of the largest one-month oil price spikes on record. Gas in California crossed $5 per gallon. Jet fuel in North America jumped 95%. Amazon, FedEx, and USPS all imposed emergency fuel surcharges.
This is not an energy market correction. It is the largest oil supply disruption in modern history — and it is actively reshaping every financial decision you are making right now.
Understanding how Middle East tensions translate into oil prices — and how those prices flow into your mortgage rate, your grocery bill, your retirement account, and your business costs — is no longer optional. It is the single most actionable piece of financial intelligence available to any American household or investor in May 2026.
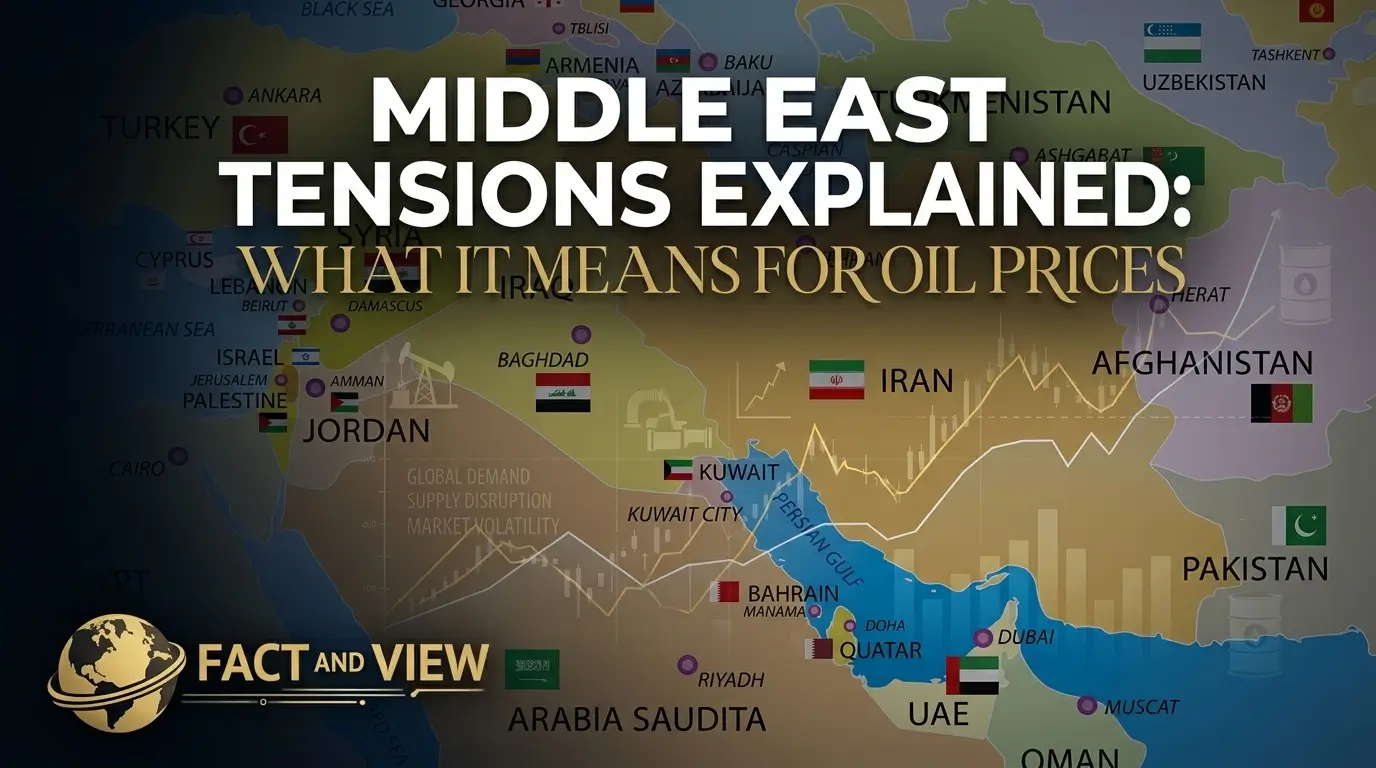
The Big Picture: The Strait of Hormuz and the Energy Chokepoint
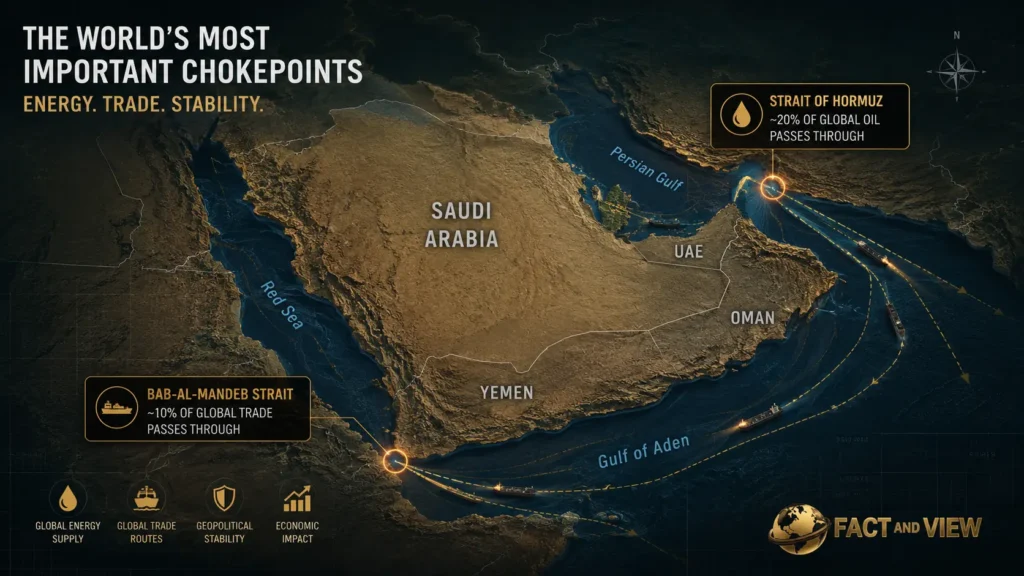
The Strait of Hormuz is a 54-kilometer waterway between Iran and Oman. Before the 2026 conflict, approximately 20 million barrels of crude oil per day transited this passage — roughly 25% of the world’s seaborne oil trade — along with 20% of global LNG volumes. On March 4, 2026, Iran closed it.
Fact: Iran’s closure of the Strait of Hormuz disrupted 20% of global oil supplies and significant liquefied natural gas volumes immediately upon enforcement, per Wikipedia’s Economic Impact of the 2026 Iran War page, cross-referenced with IEA statements. The oil production of Kuwait, Iraq, Saudi Arabia, and the UAE collectively dropped by a reported 6.7 million barrels per day by March 10, and at least 10 million barrels per day by March 12.
Fact: Brent crude surged from $72.48 on February 27 to $112.57 on March 27 — a 55.32% increase in one month, according to CNBC’s oil price timeline of the Iran war. March 2026 marked one of the largest monthly oil price surges on record. Peak prices touched nearly $120 per barrel.
Fact: The IEA’s 32 member states agreed to release 400 million barrels from strategic reserves — roughly four days of global consumption — as an emergency buffer. Even with that release, the IEA projects global oil inventories will fall by an average of 8.5 million barrels per day in Q2 2026, with the steepest drawdowns in May and June, per OilPrice.com’s IEA forecast update.
As of May 7, 2026, Brent crude futures were trading at $100.06 per barrel — down from their peak as ceasefire talks advanced, but still 38% above pre-war levels. The Strait remains functionally impaired. Negotiations between the U.S. and Iran over a 14-point memorandum of understanding — involving sanctions relief, a nuclear moratorium, and Hormuz reopening — are ongoing but fragile.
The View: The Strait of Hormuz crisis exposed the single most concentrated vulnerability in the global energy system — a chokepoint so narrow that 150 warships cannot keep it fully open, and so critical that its closure within days triggered historic price records. What this crisis has demonstrated permanently is that energy market participants systematically underpriced Hormuz closure risk for decades. That mispricing is now corrected — which means a permanent geopolitical risk premium will be embedded in oil prices for years, regardless of how the current conflict resolves.
Related reading: How the Ukraine War Is Wrecking the Global Economy in 2026 — the broader context of simultaneous conflict shocks hitting a fragile global economy.
Deep Dive: Five Oil Price Transmission Channels Into Your Financial Life
1. Gasoline Prices: The Most Visible Impact
The gas pump is where geopolitics becomes household economics. The connection is direct and rapid.
Fact: U.S. gasoline prices rose $1.16 per gallon from February 28 to the peak of the crisis, with California exceeding $5 per gallon in mid-March, per Wikipedia’s 2026 Iran war fuel crisis page. AAA national average crossed $4.16 per gallon on April 9 — the highest since 2022. On May 7, Brent settled at $100.06 — approximately 38% above where it started the year.
Fact: The U.S. benefits from its net exporter status. On April 24, U.S. exports of crude and petroleum products rose to nearly 12.9 million barrels per day — a record. American shale producers in the Permian Basin are capturing extraordinary profits from elevated global prices while domestic supply partially cushions U.S. consumers from the worst of the shock. Canada and most of Asia have no equivalent buffer.
The View: The $1.16/gallon increase translates to approximately $580 in additional annual fuel cost for the average American driver (500 gallons/year). That is real money taken directly from discretionary spending budgets — and it compounds when diesel prices (up proportionally) raise the cost of every truck-delivered good in the economy. The Hormuz closure didn’t just raise gasoline prices. It raised the price floor under every physical good that moves by road.
2. Food and Fertilizer: The Hidden Second-Order Shock
The Strait of Hormuz is not merely an oil corridor. Up to 30% of internationally traded fertilizers normally transit it — including urea, ammonia, and sulfur critical to global agriculture.
Fact: According to projections by Morningstar analyst Seth Goldstein cited in Wikipedia’s economic impact analysis, nitrogen fertilizer prices could roughly double from 2024 levels, while phosphate prices might increase by approximately 50%. The Persian Gulf accounts for 30–35% of global urea exports and 20–30% of global ammonia exports. Supply constraints coinciding with the Northern Hemisphere’s spring planting season could lower yields for staple crops including wheat, rice, and maize.
Fact: The Gulf Cooperation Council states — which rely on the Strait for over 80% of their caloric intake — experienced a “grocery supply emergency” by mid-March 2026, with 40–120% spikes in consumer prices for staples. Retailers like Lulu Retail were airlifting basic food items within two weeks of the closure.
The View: Fertilizer price doubling in a single season does not produce food inflation immediately — it produces food inflation in 2027, when the 2026 crop shortfall shows up on supermarket shelves. This lag is what most household budgeters miss. The food inflation pain from the Hormuz crisis has not yet fully arrived for American consumers. It will — in the second half of 2026 and first half of 2027, driven by both reduced U.S. crop yields from higher fertilizer costs and reduced global supply from key agricultural exporters.
Related reading: Government Spending Explained: Where Your Tax Dollars Go — including how agricultural subsidies and food assistance programs are squeezed when commodity prices spike.
3. Aviation and Shipping: The Embedded Surcharge
Jet fuel in North America jumped 95% from February to April 2026. That number is not abstract — it directly determines airline ticket prices, freight rates, and the cost of every physical product delivered to your door.
Fact: Multiple airlines raised prices for checked baggage as a direct result of jet fuel surcharges. Shipping services including USPS, Amazon, and FedEx implemented emergency fuel surcharges. The maritime insurance war-risk premium for vessels attempting Hormuz transit rose to record levels, per Wikipedia’s 2026 Strait of Hormuz crisis page. As of April 21, approximately 20,000 mariners and 2,000 ships were stranded in the Persian Gulf.
The View: Aviation and shipping fuel surcharges are embedded in prices for 6–18 months after the underlying fuel cost normalizes. Airlines file fare increases on quarterly schedules. Freight contracts are renegotiated annually. Even if Brent crude falls back to $80 by Q3 2026, the transportation cost inflation embedded in the system from the March–April peak will take until mid-2027 to fully wash through. Budget travelers and e-commerce shoppers will pay the price long after headlines move on.
4. The Federal Reserve: A Monetary Policy Paralysis Event
The oil shock’s most consequential indirect effect is on U.S. monetary policy — and therefore on every interest rate that affects your borrowing costs.
Fact: The Fed voted 8-to-4 on April 29, 2026 — the most divided FOMC vote in 34 years — to hold the federal funds rate at 3.5%–3.75%. Core PCE inflation stood at 3.0% in February; ABC News reported that the oil shock from the Hormuz crisis “could wipe out” earlier CPI progress. Markets are now pricing in zero rate cuts for 2026 and a single 25-basis-point cut in December 2027.
Fact: The 30-year fixed mortgage APR currently averages 6.54% nationally, per Bankrate’s May 7 survey. Every week of continued Hormuz disruption that keeps oil elevated adds to headline inflation, which delays the Fed’s ability to cut — which keeps mortgage rates, auto loan rates, and credit card APRs elevated.
The View: The Fed’s April vote is the clearest financial market consequence of the Hormuz crisis for American households. A central bank that could have been cutting rates in 2026 is instead frozen. The stagflationary trap — rising prices and slowing growth simultaneously — is exactly what energy supply shocks produce, and exactly what the Fed’s dual mandate is worst-equipped to resolve. This is not a temporary inconvenience. It is a structural delay to rate relief that translates to $834 per month in higher mortgage costs for a $400,000 home compared to 2021 rates.
Related reading: What the Federal Reserve Really Does — the full mechanics of how Fed decisions flow from a Middle East conflict into your monthly payment. | Interest Rates Explained: How They Affect Your Money in 2026 — the six specific consumer borrowing categories impacted by elevated rates.
5. Asymmetric Global Impact: Who Gets Hit Hardest
The oil shock is not distributed equally. The U.S. absorbs it better than almost any other economy — but its trading partners don’t, which creates second-order effects on American exports and global growth.
Fact: In 2024, 84% of crude oil passing through Hormuz was destined for Asian markets. China receives a third of its oil via the Strait, Japan sourced 94.2% of crude imports from the Middle East as of February 2026, South Korea and India are similarly exposed. The Asian Development Bank cut its 2026 growth forecast for the Asia-Pacific region from 5.1% to 4.7% directly because of the Hormuz disruption. Bangladesh faces recession-like conditions; universities closed to conserve fuel.
Fact: Alternative pipeline routes — Saudi Arabia’s East-West pipeline to Yanbu (Red Sea), UAE’s pipeline to Fujairah (Arabian Sea), Iraq’s Kirkuk-Ceyhan pipeline through Turkey — have a combined capacity of approximately 9 million barrels per day, versus 20 million that normally transit the Strait. The gap is structural and cannot be bridged quickly.
The View: China’s 2026 growth compression — the direct result of higher energy input costs and supply chain disruption — reduces demand for American goods and puts additional downward pressure on U.S. corporate earnings from Asia-Pacific operations. This is the second-order effect that equity investors are under-pricing. The S&P 500’s near-record valuation embeds continued strong corporate earnings growth — but that growth model assumed a stable energy environment. The Hormuz crisis has changed that assumption for every multinational company with Asian revenue.
Related reading: Is the Stock Market Overvalued in 2026? Full Breakdown — how energy shock compounds the already-stretched valuation case for U.S. equities. | Where Smart Money Is Moving Right Now — the institutional reallocation triggered by exactly this type of geopolitical supply shock.
Risks & Opportunities: Three Oil Market Scenarios
The U.S.-Iran memorandum of understanding is signed. The Strait of Hormuz reopens progressively through June–July. Brent retreats to $80–$90 range as speculative positioning unwinds. Per Commodity Context analyst Rory Johnston: “Any reopening of the strait would likely trigger an immediate $10–$20 drop in crude prices due to speculative positioning, but relief would be temporary. Supply chain bottlenecks, infrastructure damage, and lingering production outages would keep the market tight, likely anchoring Brent in the $80–$90 range rather than a full return to pre-crisis levels.”
What this means for you: Gas prices drop $0.50–$0.75/gallon within 2–3 weeks of reopening. Airline surcharges take 3–6 months to reverse. Fertilizer-driven food inflation continues feeding through until Q1 2027. The Fed gets modest room to consider one cut in late 2026. Mortgage rates ease toward 6.0%–6.2%.
Upside Scenario (~20% probability): Full Diplomatic Resolution, Oil Returns to $70–$75
A comprehensive U.S.-Iran deal — nuclear moratorium, sanctions relief, permanent Hormuz access — restores full commercial traffic by August. Gulf production resumes. Brent falls to $70–$75. The Fed gains room for two cuts. Mortgage rates ease toward 5.5%–5.75%.
What this means for you: This is the scenario where the geopolitical risk premium fully unwinds. Airline tickets fall materially. Grocery price pressure eases by late 2026. Mortgage refinancing becomes viable for 2023–2024 buyers. Defensive assets (gold, energy stocks, TIPS) give back some of their gains as risk appetite returns.
Downside Scenario (~35% probability): Escalation, Brent Above $115 Through Q3
Ceasefire negotiations collapse. U.S. military escalates strikes on Iranian infrastructure. Iran retaliates against Saudi or UAE oil facilities. Brent returns above $115 — potentially testing the $120 peak. IEA reserves cannot cover a sustained multi-quarter deficit. Global inflation spikes toward the IMF’s adverse scenario: growth at 2.5%, inflation at 5.4%.
What this means for you: Gas returns to $4.50+ nationally, above $5.50 in California. The Fed cannot cut under any circumstances — potentially forced to raise rates if inflation becomes entrenched. Mortgage rates push toward 7%–7.5%. Corporate earnings revisions accelerate to the downside. This is the scenario where energy stocks and gold are the only reliable return generators in the portfolio.
Related reading: What Happens If a Global Conflict Escalates? Economic Impact — the IMF’s three formal scenarios for escalation, with precise GDP and inflation projections. | US National Debt Explained: Should You Be Worried? — how the energy crisis is compounding the fiscal stress on a government already paying $1 trillion/year in debt interest.
The Bottom Line
The Middle East tensions and their impact on oil prices in 2026 are not a background geopolitical story. They are the dominant financial variable in the U.S. economy right now — more immediately consequential than any Fed decision, more impactful than the midterm election outcome, and more structurally significant than any quarterly earnings report.
For consumers:
- Gas prices will remain elevated through at least Q3 2026 in all scenarios — budget $3.80–$4.50/gallon for planning purposes through September
- Food inflation driven by fertilizer costs has not yet peaked — the grocery impact from spring 2026 planting season disruption arrives in H2 2026 and H1 2027; adjust your household budget now
- Rate relief is delayed — don’t assume the Fed cuts in 2026. Track weekly mortgage rates at Freddie Mac’s PMMS and Fed expectations at CME FedWatch
For investors:
- U.S. energy producers (ExxonMobil, ConocoPhillips, Devon Energy, Pioneer) are structural winners in all three scenarios — elevated prices in the base and downside cases, and the “sell the news” benefit in the upside case as reopening triggers a short-term rally
- Gold and TIPS perform across all three scenarios — the geopolitical risk premium, once established, doesn’t fully disappear even with a diplomatic resolution
- International equity exposure — particularly Asia-Pacific — faces the greatest earnings risk from sustained Hormuz disruption; consider hedging or trimming EM positions until the supply situation normalizes
For businesses:
- Energy cost hedging is a Q2 priority, not a future consideration — forward contracts, fuel surcharge clauses, and supplier agreements with price caps need to be executed now, not after the next escalation headline
- Any business with Asian suppliers or customers must model a scenario where Chinese, Japanese, and Korean economic growth disappoints by 0.5–1.5 percentage points versus January forecasts — that’s not a tail risk; it’s the base case for affected economies
The Strait of Hormuz is 54 kilometers wide. The economic consequences of its closure span the entire planet.
Continue reading from Fact and View:
- How US Elections Affect the Economy and Markets — the November midterms layer on top of the energy shock in shaping fiscal and monetary policy
- Is Crypto Coming Back in 2026? — how the geopolitical risk environment is shaping Bitcoin’s correlation with oil and safe-haven assets
- Will Housing Prices Drop in 2026? — the direct link from Hormuz to mortgage rates to the housing market affordability crisis
FAQ
Why did the Middle East conflict cause oil prices to spike so dramatically in 2026?
The Strait of Hormuz closure removed approximately 20 million barrels of daily oil flow from global markets — roughly 20% of world oil supply — simultaneously. No alternative route can fully replace that volume. The East-West pipeline, UAE’s Fujairah pipeline, and Iraq’s Ceyhan pipeline combined can handle roughly 9 million barrels per day versus the 20 million the Strait normally carries. That structural deficit of 11 million barrels per day — in a market with no spare capacity — produced the fastest sustained oil price spike in modern history, surging 55% in four weeks. Track current Brent crude prices at TradingEconomics and real-time EIA inventory data at eia.gov.
Will gas prices go back down to $3 per gallon in 2026?
Unlikely before late Q3 at the earliest — and only in the upside diplomatic scenario. Commodity Context analyst Rory Johnston’s assessment is clear: even with Hormuz reopening, “supply chain bottlenecks, infrastructure damage, and lingering production outages would keep the market tight, likely anchoring Brent in the $80–$90 range rather than a full return to pre-crisis levels.” At $80–$90 Brent, U.S. regular gasoline settles approximately in the $3.40–$3.80 range nationally. A return to $3.00 requires Brent to fall below $70 — which requires both a diplomatic resolution and a significant demand slowdown. Monitor daily national average gas prices at AAA Gas Prices.
How does the Middle East oil shock affect inflation in the US?
Through three channels. First, higher gasoline prices directly raise the energy component of CPI — which was already running at 3.3% in March 2026. Second, higher diesel prices raise the cost of transporting every good in the economy, feeding into core goods inflation with a 1–3 month lag. Third, higher fertilizer costs — from both natural gas and Hormuz disruption of Gulf fertilizer exports — feed into food prices with a 6–12 month lag. The IMF’s reference scenario (19% energy price increase) puts global headline inflation at 4.4% for 2026 — its adverse scenario (80% oil spike) raises it to 5.4%. Track U.S. inflation monthly at BLS.gov/CPI.
What is the Strait of Hormuz and why does it matter so much?
The Strait of Hormuz is a 54-kilometer-wide waterway between Iran and Oman at the mouth of the Persian Gulf. It is the world’s most critical oil chokepoint. Before the 2026 conflict, approximately 20–25% of the world’s seaborne oil trade and 20% of global LNG trade transited it daily — including the vast majority of exports from Saudi Arabia, Iraq, Kuwait, UAE, and Qatar. It also carries approximately 30% of the world’s internationally traded fertilizers. There is no adequate alternative route: alternative pipelines can handle less than half the normal Strait volume, and re-routing adds significant cost and transit time. The official U.S. Energy Information Administration analysis of Hormuz is available at eia.gov/countries/regions-topics/Hormuz.
Is this the worst oil crisis in history?
By supply disruption volume, yes. The IEA’s executive director explicitly described it as “the greatest global energy security challenge in history.” The 1973 oil embargo removed roughly 4–5 million barrels per day from the market. The Hormuz closure removed 10–20 million barrels per day at its peak — two to five times larger in absolute volume. The 1973 shock triggered a decade of stagflation. The 2026 shock hits a global economy that is already running above-target inflation, carrying record levels of public debt, and has central banks with less room to tighten than in 2022. The IMF comparison to 1973 is not hyperbole — it is the Fund’s own language in its April 2026 World Economic Outlook.
Which assets benefit most from the Middle East oil price spike?
Based on current market performance through May 2026:
Losers: Airlines (95% jet fuel spike), consumer discretionary (purchasing power erosion), import-dependent manufacturers, Asian emerging market equities
U.S. energy producers (ExxonMobil, ConocoPhillips, Devon Energy) — direct revenue beneficiary of Brent above $100
Gold — hit all-time highs above $5,000/oz in Q1 2026, benefiting from both safe-haven demand and inflation hedging; track at Kitco
Defense contractors (RTX, LMT, NOC, Rheinmetall) — elevated geopolitical tension drives procurement spending
TIPS (Treasury Inflation-Protected Securities) — real yields of 1.25%–2.0% plus inflation adjustment make these structurally attractive when oil is driving CPI above target
Where can I track oil prices and Hormuz developments in real time?
The most reliable, free primary sources:
TradingEconomics — Brent Crude — live futures price with historical chart
EIA Weekly Petroleum Report — official U.S. government oil supply, inventory, and price data, updated weekly
IEA Oil Market Report — monthly global oil supply and demand analysis
CNBC Oil Market Hub — live Brent and WTI prices with news
AAA Gas Prices — daily national and state-level gasoline averages
CME FedWatch — how oil-driven inflation expectations affect Fed rate probability
Sources: CNBC — Oil Price Timeline, Iran War, April 21, 2026 · CNBC — Oil Prices May 7, 2026 · Al Jazeera — Oil Prices Soar on Hormuz Fears, April 30, 2026 · OilPrice.com — IEA Forecast Revised, May 2026 · Wikipedia — Economic Impact of 2026 Iran War · Wikipedia — 2026 Strait of Hormuz Crisis · Wikipedia — 2026 Iran War Fuel Crisis · IMF World Economic Outlook, April 2026 · WEF — Global Price Tag of War in the Middle East, March 12, 2026 · Federal Reserve FOMC Statement, April 29, 2026 · Bankrate Mortgage Rates, May 7, 2026
© Fact and View, 2026. For informational purposes only. Not investment advice.


Be First to Comment