
American investors are borrowing money to buy stocks at a pace not seen in nearly three decades. U.S. margin debt — what investors borrow from their brokerages to purchase securities — reached a record $1.42 trillion in May 2026, according to FINRA data, up 53.7% from a year earlier. Investors added roughly half a trillion dollars in borrowed money to their stock market bets in just twelve months.
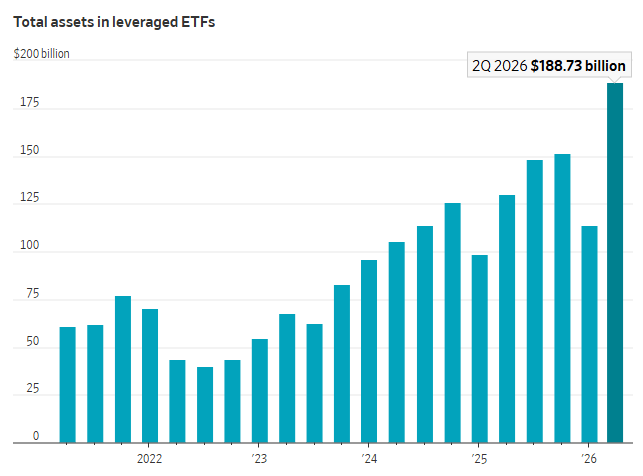
Alongside that borrowing surge, leveraged exchange-traded funds — products designed to deliver two or three times the daily return of an underlying index — have nearly doubled in assets, from roughly $120 billion in late March to $220 billion by early June. On June 5, 2026, a 3x leveraged semiconductor ETF dropped 31% in a single trading session, a stark reminder of how these instruments amplify losses as precisely as they amplify gains.
None of this means a crash is imminent. But it does raise a legitimate question that deserves a clear, evidence-based answer rather than a sensational one: what does record margin debt actually tell us, and how worried should the average investor be?
What Is Margin Debt, in Plain Terms?
Margin debt is simply a loan from your brokerage, using the stocks you already own as collateral.
Here’s how it works in practice. An investor deposits cash or securities into a brokerage account, and the brokerage allows them to borrow additional funds — typically up to 50% of the value of marginable securities — to purchase more stock than they could with cash alone. If a stock goes up, the investor’s gains are calculated on the full leveraged position, not just their own cash contribution, which magnifies the percentage return on their actual investment.
The mechanics cut both ways, which is the central fact every investor needs to internalize. If a $10,000 cash investment grows 20%, the investor has $12,000 — a $2,000 gain. If that same investor borrows another $10,000 on margin to buy $20,000 worth of stock, and the position grows 20%, they now have $24,000. After repaying the $10,000 loan, they’re left with $14,000 — a $4,000 gain on their original $10,000, or 40%. The leverage doubled the percentage return.
But the reverse is equally true. A 20% decline on that same leveraged position turns a $2,000 paper loss on an unleveraged position into a $4,000 loss on the leveraged one — a 40% hit to the investor’s actual capital. And if the stock falls far enough, the brokerage issues a margin call, demanding additional cash or securities to maintain the required collateral ratio. If the investor can’t meet that call, the brokerage can sell the position automatically, often at the worst possible moment.
Why margin debt rises during bull markets: Rising stock prices expand investors’ collateral value, which expands their borrowing capacity — a self-reinforcing cycle. Strong returns also make leverage feel manageable, since recent gains create a psychological cushion that encourages additional risk-taking. This pattern isn’t new to 2026; margin debt has historically tracked bull markets closely for decades.
Related reading: How Beginners Should Invest in 2026 — for readers building a foundational, lower-risk investing strategy before considering any form of leverage.
Why Margin Debt Is Hitting Records in 2026
Several distinct forces are converging to drive this borrowing surge, and most analysts attribute the increase to genuine market enthusiasm rather than a single isolated cause.
- A strong, AI-driven bull market. The S&P 500, Nasdaq, and Dow have all rallied roughly 20% over the past year to record territory, with gains heavily concentrated in technology and semiconductor stocks tied to artificial intelligence infrastructure spending.
- Retail investor participation at scale. The combination of zero-commission trading, easy margin access, and mobile brokerage apps has lowered the barrier to leveraged investing for a much broader population of traders than in prior cycles.
- Explosive growth in leveraged ETF products. These funds give retail investors an alternative path to amplified exposure without opening a traditional margin account, and trading volumes in U.S.-listed leveraged and inverse ETFs surged roughly 50% year-over-year in the first half of 2026, according to Goldman Sachs.
- Institutional leverage growing alongside retail. This isn’t purely a retail phenomenon — the Federal Reserve’s November 2025 Financial Stability Report found hedge fund leverage was “as high as it has been since comprehensive data have been collected,” with hedge fund leverage up nearly 14%.
- Confidence reinforced by recent gains. As prices climb, both retail and institutional investors extrapolate recent performance forward, a well-documented behavioral pattern that tends to peak alongside, not before, periods of strong market enthusiasm.
It’s worth emphasizing what this data does not show: margin debt alone has never been demonstrated to directly cause a market downturn. It is best understood as a measure of investor risk appetite and confidence — a symptom of bullish sentiment, not an independent trigger.
Related reading: Is It Too Late to Invest in AI Stocks? — the AI infrastructure buildout that is concentrating much of this leverage in technology and semiconductor names specifically.
The Role of Leveraged ETFs
Leveraged ETFs deserve particular attention because they function differently than most investors assume, and that difference matters enormously for how they should be used.
A 2x or 3x leveraged ETF is designed to deliver double or triple the daily performance of its target index — not the cumulative return over weeks or months. The fund achieves this through derivatives and daily rebalancing, resetting its exposure every single trading day to maintain the target leverage ratio.
That daily reset is the critical detail most retail investors overlook. In a volatile, sideways-trending market, daily compounding can cause a leveraged ETF to lose value even if the underlying index ends up roughly flat over the same period — a phenomenon often called “volatility decay.” This is precisely why these products are built for short-term tactical trading, not buy-and-hold investing.
Fact: Roughly 85% of leveraged ETF assets are concentrated in just three sectors — technology, artificial intelligence, and semiconductors — meaning the risk in these products is not just amplified but also highly concentrated. Nomura strategist Charlie McElligott has flagged a related mechanical risk: leveraged ETFs must buy more of an asset as it rises and sell more as it falls to maintain their daily target ratio, creating rebalancing flows that can intensify price swings in both directions during periods of high volatility.
The June 5 episode illustrates the math precisely: a 3x leveraged semiconductor fund fell 31% in a single session — roughly triple the decline of its underlying benchmark, exactly as the product is engineered to do.
Why Some Analysts Are Concerned
Market strategists and regulators have raised several specific, well-documented concerns rather than vague unease.
- Forced-selling dynamics. When leveraged positions decline sharply, falling collateral values can trigger automatic margin calls and forced liquidations, which in turn push prices lower and can trigger further margin calls — a cascading mechanism market participants refer to as a deleveraging spiral.
- Historical pattern recognition. Notable margin debt surges have preceded or coincided with prior market peaks, including March 2000 ahead of the dot-com crash, July 2007 months before the 2008 financial crisis, and October 2021 ahead of the 2022 market drawdown. Analysts note this is a pattern worth watching, not a guaranteed predictor.
- The “tail wagging the dog” problem. Dave Nadig, director of research at ETF.com, has warned that if a leveraged fund grows large enough, its required daily rebalancing trades can begin to meaningfully influence the price of the underlying stock itself — creating mechanical, price-indiscriminate buying and selling pressure that exists independent of company fundamentals.
- Record-low investor cash cushions. The “credit balance” metric — cash and credit balances in margin accounts minus margin debt — sat at a record low of negative $991.7 billion as of May 2026, meaning investors collectively owe brokerages far more than they hold in available cash, a historic extreme by this measure.
- Compounding leverage layers. Barclays analysts estimate leveraged funds have purchased roughly $300 billion in single-stock and index derivatives since late March alone, adding a further layer of synthetic exposure on top of traditional margin debt.
It’s worth noting an important balancing fact: despite record margin debt, U.S. households were also sitting on roughly $8.3 trillion in cash at the end of the first quarter of 2026, according to Federal Reserve data — meaning elevated leverage exists alongside, not instead of, substantial dry powder still on the sidelines.
Related reading: Fed Rate Hikes: Fighting Inflation or Slowing Growth? — how a hawkish shift in Federal Reserve policy is specifically cited by analysts as a potential catalyst for a deleveraging event.
The Bullish Counterargument
Investors who remain confident despite the leverage buildup point to a different, equally fact-based set of arguments.
- Genuine earnings growth, not pure speculation. A meaningful share of the rally is tied to real corporate earnings strength, particularly among the largest technology companies, rather than purely sentiment-driven price appreciation.
- The AI capital expenditure cycle remains historically large. AI infrastructure investment is tracking toward roughly $1.5 trillion annually by 2030, representing what some analysts describe as the largest capital expenditure cycle on record — a structural, multi-year tailwind rather than a short-term trend.
- A resilient broader U.S. economy. Despite pockets of volatility tied to geopolitical events, the underlying domestic economy has continued to support corporate revenue and consumer spending.
- Today’s market structure differs from prior cycles. Modern margin requirements, clearing mechanisms, and broker risk controls are more developed than in 2000 or 2007. Charles Schwab, for example, moved to tighten margin requirements and issue margin calls to clients exceeding new risk thresholds in June 2026 — evidence that brokerages are actively monitoring and managing this exposure in real time, not ignoring it.
- Long-term confidence in American equities. Many investors continue to view leverage as a rational tool for expressing high conviction in specific sectors, rather than uncontrolled speculation, particularly when used for shorter time horizons consistent with how leveraged products are actually designed to function.
What Individual Investors Should Consider
Regardless of where the broader market heads next, a few practical principles apply to any investor evaluating leverage in their own portfolio.
Understand what you’re buying before you use leverage. Margin loans and leveraged ETFs are fundamentally different products with different risk profiles, and neither is designed for investors who don’t fully understand the mechanics of daily compounding, margin calls, or interest costs on borrowed funds.
Diversify rather than concentrate. With roughly 85% of leveraged ETF assets concentrated in technology, AI, and semiconductor names, investors using these products are often taking on significant sector-specific risk in addition to leverage risk — a combination that can compound losses during a sector-specific downturn.
Avoid emotional decision-making during volatility. Forced selling during sharp downturns is, by definition, involuntary — but voluntary panic selling by investors who didn’t fully understand their leverage exposure compounds the problem. Knowing your actual risk tolerance before volatility hits matters more than reacting to it afterward.
Remember that higher potential returns require higher risk tolerance. Leverage doesn’t create returns from nothing — it borrows from the future to amplify whatever happens next, in either direction. That trade-off is mathematically certain, even when market direction isn’t.
Related reading: Best Investments During Inflation (2026 Guide) — for investors seeking diversification strategies that don’t depend on leverage or sector concentration.
The Bottom Line
Record margin debt of $1.42 trillion, alongside leveraged ETF assets approaching $220 billion, is a genuine and well-documented signal of elevated investor confidence and risk appetite in 2026. Strategists across Wall Street, from Nomura to Morgan Stanley, are watching it closely, and for good reason: the historical pattern of rising leverage during late-stage bull markets is real and worth monitoring.
But margin debt is not, on its own, a reliable standalone predictor of when or whether a correction occurs. It is best understood as a barometer of sentiment — a measure of how much conviction investors currently have in the market’s direction — rather than a mechanism that independently causes prices to fall. Markets have sustained elevated leverage for extended periods before, just as they have occasionally seen leverage unwind sharply and rapidly.
For individual investors, the most useful response to this data isn’t to predict the next move in the S&P 500. It’s to honestly assess your own use of leverage, diversification, and risk tolerance — and to remember that the same mechanics amplifying recent gains are mathematically certain to amplify losses with equal force whenever the cycle eventually turns.
Sources: FINRA Margin Debt Statistics · Advisor Perspectives — Margin Debt Jumps 8.5% in May, June 24, 2026 · The Epoch Times — Stock Market Boom Pushes Borrowing Binge to Record $1.4 Trillion · Atlantic Council — As Markets Turn Volatile, Leverage Is Back in the Spotlight, January 22, 2026 · Federal Reserve Financial Stability Report, November 2025 · Goldman Sachs leveraged ETF volume analysis, 2026 · Barclays derivatives market analysis, 2026
© Fact and View, 2026. For informational purposes only. Not investment advice.


Be First to Comment