On May 16, 2025, Moody’s became the last of the three major credit rating agencies to strip the United States of its AAA sovereign credit rating — downgrading to Aa1, citing “the increase in government debt and interest payment ratios to levels that are significantly higher than similarly rated sovereigns.” The 30-year Treasury yield briefly broke above 5% on the news. The 10-year yield hit 4.56%. And within 24 hours, markets essentially shrugged.
That shrug is the most dangerous thing about the US debt trajectory.
Markets have absorbed each deterioration — S&P’s 2011 downgrade, Fitch’s 2023 downgrade, Moody’s 2025 downgrade — without a crisis. That resilience has been read as validation that the debt doesn’t really matter. It is more accurately read as evidence that crises don’t announce themselves in advance. The absence of a crisis today is not evidence that a crisis is impossible tomorrow. It is evidence that the threshold has not yet been crossed — and that threshold is moving closer with each fiscal year.
The Congressional Budget Office’s February 2026 long-term outlook projects federal debt rising from 100% of GDP today to 120% in 2036, 129% in 2040, and 175% in 2056. The OBBBA’s deficit expansion has pushed the 2055 projection 16 percentage points higher than last year’s estimate. The trajectory is not ambiguous. The question is what it produces — and when.
The Big Picture: From Record to Crisis Is Not One Step, It’s a Ramp
The US debt is not approaching a cliff. It is ascending a ramp whose slope is steepening year by year.
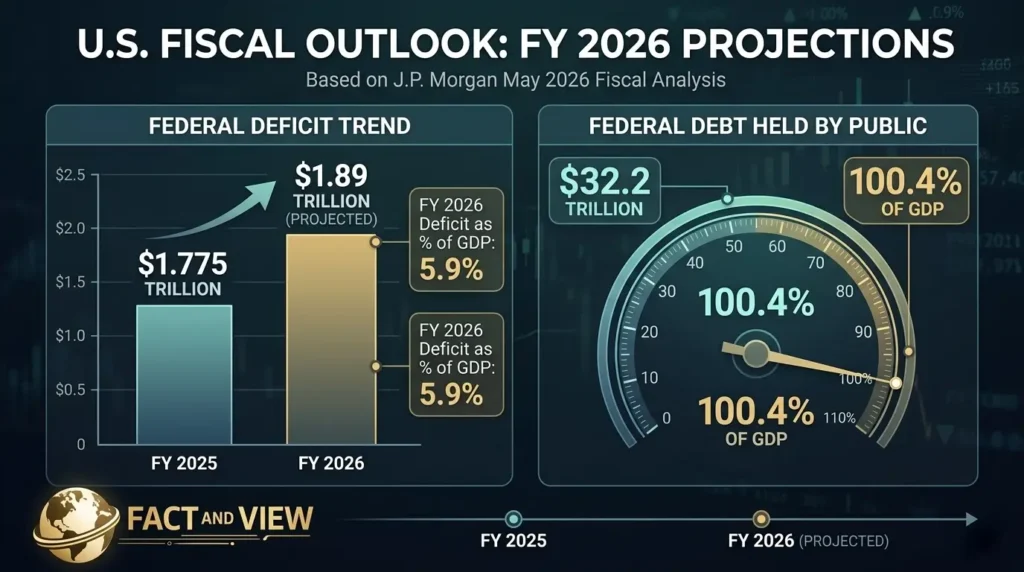
Fact: The FY 2026 federal deficit is projected at approximately $1.89 trillion — 5.9% of GDP — up from $1.775 trillion in FY 2025, per J.P. Morgan’s May 2026 fiscal analysis. Federal debt held by the public will reach $32.2 trillion by end of FY 2026 — 100.4% of GDP.
Fact: CBO projects the deficit-to-GDP ratio will average 6.1% over the next decade, reaching 6.7% by 2036 — far above Treasury Secretary Bessent’s stated goal of 3%, per Al Jazeera’s February 2026 CBO coverage. Annual deficits were 6% of GDP or higher only during wartime and major recessions historically — the US is now running them in a period of positive economic growth.
Fact: Brookings Institution’s March 2026 fiscal update finds the long-term fiscal outlook has deteriorated further since last year. The 2055 debt-to-GDP ratio has risen from 156% (last year’s CBO estimate) to approximately 172% — with additional borrowing from the OBBBA and higher interest rates accounting for the increase.
The View: The US debt trajectory has no historical precedent in peacetime. The only period with comparable debt-to-GDP ratios — post-World War II — resolved through decades of strong economic growth, demographic tailwinds, and a manufacturing export boom that no longer applies. Today’s context is structurally different: an aging population, slowing productivity growth, a $1 trillion annual interest bill, and a political system that has proven incapable of delivering fiscal consolidation. The ramp is real. The only uncertainty is the gradient.
Related reading: US National Debt Explained: Should You Be Worried? — the current debt level, interest payment trajectory, and near-term consequences already arriving in bond markets.
Deep Dive: Five Consequences When Debt Keeps Rising
1. Borrowing Costs Rise for Everyone — Not Just the Government
The federal government’s interest costs are the fastest-growing budget category. But the transmission from government borrowing to household and business borrowing costs is what makes this a personal finance issue, not just a fiscal policy abstraction.
Fact: CBO’s February 2026 projections show net interest payments rising from 3.3% of GDP in 2026 to 4.6% of GDP by 2036. At the long end of the fiscal projection (2056), interest is projected to consume 6.9% of GDP — more than double today’s level, per CRFB’s March 2026 analysis of CBO’s long-term outlook.
Fact: CBO projects the 10-year Treasury yield at 4.1% in 2026 (up from 3.9% in last year’s forecast), rising to 4.4% by 2031 and remaining elevated for the entire projection period, per the Conference Board’s analysis of CBO’s 2026–2036 outlook. This structural upward pressure on 10-year yields directly sets the floor for 30-year mortgage rates.
The transmission chain:
- More Treasury issuance → more supply of bonds → buyers demand higher yields → 10-year Treasury yields rise → mortgage rates follow
- Mortgage at 6.5% (current) vs. 3.0% (2021) on a $400,000 loan: difference of $834/month — or approximately $300,000 over 30 years
- Business loan rates rise proportionally — every business investment project evaluated at a higher discount rate faces a higher hurdle for profitability
The View: The “crowding out” effect — government borrowing competing with private investment for available capital — is not theoretical in 2026. It is measurable in every rate-sensitive economic activity. When the government needs to sell $7+ trillion in gross Treasury issuance annually to finance both new deficits and refinance maturing debt, it consumes a significant share of available global investor appetite for dollar-denominated assets. That absorption comes at a price — and private borrowers pay it.
2. Growth Slows — Permanently and Measurably
High debt levels do not produce catastrophic crashes on a predictable schedule. They produce a slow, persistent drag on economic performance that compounds over time.
Fact: CBO is explicit in its February 2026 outlook: “If federal debt held by the public kept growing faster than GDP, as CBO projects it would under current law, it would have far-reaching implications for the nation’s fiscal and economic outlook. That large and growing debt would have many consequences, including the following: Borrowing costs throughout the economy would rise, reducing private investment and slowing the growth of economic output.”
Fact: The American Action Forum’s December 2025 analysis of CBO data quantifies the mechanism: high debt reduces the private capital stock by crowding out investment, which reduces labor productivity, which reduces wages and income growth. The AAF estimates that under the current trajectory, income per person grows more slowly than in a lower-debt scenario — a permanent and compounding reduction in living standards.
Fact: The OBBBA’s CRFB analysis shows the legislation’s direct fiscal impact increased 10-year cumulative deficits by $4.7 trillion from tax provisions, offset partially by $3 trillion in higher tariff revenue — leaving a net $1.4 trillion increase in projected deficits through 2035.
The View: The economic cost of high debt is invisible in quarterly GDP data but measurable over decades. An economy that grows at 2.1% instead of 2.5% annually looks nearly identical in any given year. Over 30 years, it produces approximately 15% lower cumulative economic output — equivalent to removing several years of normal growth from the national economy. The individuals who feel this most are those entering the workforce today, who will spend their careers in an economy with a structurally lower growth ceiling than their parents experienced.
3. The Moody’s Downgrade: What It Actually Signals
The downgrade itself is not the crisis. It is the signal that the three most powerful private credit assessors in the world now agree: the United States is no longer the gold standard of fiscal management.
Fact: On May 16, 2025, Moody’s downgraded the US sovereign credit rating from Aaa to Aa1 — joining S&P (downgraded 2011) and Fitch (downgraded 2023) in removing the US from the AAA tier. Moody’s explicitly cited projections showing the federal budget deficit reaching nearly 9% of GDP — “significantly higher than similarly rated sovereigns.” The term premium on 10-year Treasuries — the additional yield investors demand to compensate for holding long-dated debt — turned positive in November 2024 and by May 2025 was adding approximately 75 basis points onto 10-year yields, per RSM’s analysis.
Fact: Yale Budget Lab estimates that legislation enacted and proposed through early 2025 would add $3.4 trillion to the federal debt from 2025 to 2035 and $13.5 trillion from 2025 to 2055.
The View: Three consecutive credit downgrades — S&P in 2011, Fitch in 2023, Moody’s in 2025 — have each produced short-term market volatility followed by apparent normalization. This is being interpreted as evidence that credit ratings don’t matter for the US. That interpretation is wrong. What each downgrade actually did was shift the long-term term premium — the structural component of yields that reflects the risk of holding US Treasuries over time. That premium has gone from negative (investors paid to hold safe Treasuries) to positive (investors now demand compensation). Each basis point of term premium is a permanent increase in US borrowing costs that compounds on every dollar of debt issued. The effect is not visible in daily price action. It is visible in the 30-year cost of financing the national debt.
4. Reduced Crisis Capacity: The Most Underpriced Risk
The most dangerous consequence of rising debt is not what it costs in normal times. It is what it costs the country when the next shock arrives.
Fact: In 2008, US federal debt was approximately 40% of GDP. The government deployed $700 billion in TARP plus additional stimulus totaling roughly $1.5 trillion. In 2020, US debt was approximately 79% of GDP. The COVID response totaled approximately $5 trillion. Today, debt is 100% of GDP and rising toward 120% in 2036. Replicating a $5 trillion emergency response from this starting point requires issuing debt in a market that is already showing demand stress and in an environment where interest on existing debt consumes $1 trillion annually.
Fact: Econofact’s 2026 explainer on federal debt risk is unambiguous: “Putting federal debt on a more sustainable path, strengthening fiscal governance, and improving preparedness for a potential crisis would reduce vulnerability and limit the economic and social damage if confidence were to falter. Acting before financial markets force changes in policies would give policymakers more flexibility and help avoid the most disruptive outcomes.”
The View: The US retains unique advantages — dollar reserve status, deep capital markets, Fed independence — that make a sovereign debt crisis categorically different from what Argentina, Greece, or Turkey experienced. But those advantages reduce the probability of a crisis, not the consequence. If confidence does falter, the US has fewer tools to respond than in any previous economic shock of the modern era. That asymmetry — lower probability, catastrophically higher consequence if it occurs — is the argument for fiscal action that the political system has consistently refused to process.
5. The Dollar’s Reserve Status: Long-Term But Not Eternal
The US dollar’s reserve currency status is the ultimate backstop of the debt trajectory. As long as global trade is priced in dollars and foreign governments hold Treasuries as their primary reserve asset, the US can sustain debt levels that would crash other countries.
Fact: Approximately 58% of global foreign exchange reserves are held in US dollars, per IMF COFER data as of Q4 2025 — down from 72% in 2001. Chinese central bank gold purchases, BRICS payment system development, and reduced reliance on SWIFT by sanctioned countries all represent marginal diversification away from dollar assets. The trend is slow and multi-decade — but it is real and directional.
Fact: Central banks globally bought a record 244 tonnes of gold in Q1 2026, per the World Gold Council — driven in part by diversification away from dollar-denominated reserve assets. The structural demand for gold at the sovereign level is inseparable from the structural concern about US fiscal credibility at the sovereign level.
The View: The dollar’s reserve status is the US’s most valuable fiscal asset — and its most fragile. It does not disappear suddenly. It erodes gradually, as has been happening for two decades. When it has eroded sufficiently, the US loses the “exorbitant privilege” of borrowing in its own currency at artificially low rates — and the fiscal arithmetic that currently looks difficult becomes impossible. This is not a 2026 event. It is a 2030s or 2040s risk. But every year of fiscal deterioration accelerates the timeline.
Related reading: Where Smart Money Is Moving Right Now (2026 Update) — why institutional investors are buying gold at record pace, directly connected to this dollar reserve erosion dynamic.
Risks & Opportunities: Three Debt Scenarios
Base Case (~50% probability): Continued Deterioration, No Crisis
Debt rises to 120% of GDP by 2036 as projected. Interest consumes an ever-larger share of federal revenue. Discretionary programs face ongoing compression. Mortgage rates remain structurally elevated at 6%+. No acute market crisis.
What this means for you: Slow economic growth, elevated borrowing costs, and reduced federal services are the permanent background conditions of the next decade. TIPS, gold, and short-duration bonds remain structurally attractive as inflation and yield-pressure hedges.
Upside Scenario (~20% probability): Growth and Bipartisan Reform
AI-driven productivity boosts GDP growth above 2.5% sustainably. A bipartisan fiscal deal — forced by bond market pressure — combines Social Security reform, targeted spending restraint, and revenue adjustments. Debt trajectory bends. Long-term yields ease. Mortgage rates fall toward 5.5%.
What this means for you: The most constructive long-run scenario for real estate affordability, equity valuations, and fiscal sustainability simultaneously. It requires political will with no current precedent — but bond market discipline has forced comparable reforms in Canada (1995), Sweden (1994–1996), and Ireland (2008–2013).
Downside Scenario (~30% probability): Bond Market Discipline Event
A sustained loss of appetite for US Treasuries — from foreign reserve diversification, domestic institutional reallocation, or a shock that triggers risk repricing — forces the 10-year yield above 5.5%. Mortgage rates return toward 7.5%–8%. Emergency fiscal austerity arrives suddenly rather than through deliberate policy. A debt ceiling confrontation in Q1 2027 further strains market confidence.
What this means for you: This is the scenario where the slow-burn becomes visible. Every rate-sensitive financial decision — mortgage refinancing, business investment, consumer borrowing — becomes materially more expensive virtually overnight. Gold, TIPS, and short-duration Treasuries are the portfolio positions that perform best when this scenario materializes.
Related reading: Government Spending Explained: Where Your Tax Dollars Go — the full budget decomposition that shows where fiscal cuts would land if the downside scenario forces emergency austerity.
The Bottom Line
The US debt rising from 100% to 175% of GDP over the next 30 years is not a distant abstraction. Its consequences are already embedded in your current financial conditions — in the mortgage rate you are paying, the interest rate relief you are waiting for, and the federal programs you depend on that face persistent budget pressure.
For consumers:
- Structural upward pressure on Treasury yields means mortgage rates stay elevated longer than Fed policy alone would produce. Budget for 6%+ through 2027 at minimum — use Freddie Mac’s PMMS to monitor weekly movement
- High-yield savings at 4.5%–5% and TIPS at 1.5%+ real yield are the most accessible inflation- and rate-environment hedges for individual savers — lock in CD rates before the (eventual) cut cycle begins
- Social Security’s solvency trajectory and rising debt are linked — model your retirement with a 20–25% benefit reduction as a planning contingency
For investors:
- The TIPS and gold allocation case is not speculative — it is a response to a verified, documented fiscal trajectory that raises real and nominal inflation risk over the long run
- Long-duration nominal Treasury bonds carry structural yield risk in a rising-debt environment — short-duration instruments reduce duration exposure while still capturing elevated yields
- US equity allocations should account for the crowding-out effect on corporate investment and the structural growth drag the CBO explicitly acknowledges in its projections
For business owners:
- Model your capital investment decisions across a rate range of 5%–7% on 10-year money — the fiscal trajectory makes structurally lower rates unlikely within your planning horizon
- The OBBBA’s expiring provisions create 2027–2028 tax uncertainty wider than at any point since 2000 — build contingency models for both extension and expiration scenarios
- Federal contract and program revenue is subject to increasing fiscal pressure — build 90-day contingency reserves for discretionary program disruption
The US government is not going bankrupt in 2026. The dollar is not being dethroned this year. But the ramp is real, the slope is steepening, and the costs are already flowing — into your mortgage payment, your savings rate, your Social Security projections, and the economic growth that determines your wages for the next decade.
Acting on this information — while others wait for the headline crisis — is the definition of financial intelligence.
FAQ
What is the US national debt right now and how fast is it growing?
Federal debt held by the public — the portion financed in bond markets — reached $32.2 trillion or approximately 100.4% of GDP by end of FY 2026, per J.P. Morgan’s May 2026 fiscal analysis. The federal deficit for FY 2026 is approximately $1.89 trillion — 5.9% of GDP. CBO projects debt rising to 120% of GDP by 2036 and 175% by 2056. The trajectory has accelerated following the OBBBA’s $4.7 trillion in tax provisions, pushing the long-term outlook approximately 16 percentage points higher than last year’s CBO estimate. Track the real-time debt figure at TreasuryDirect’s Debt to the Penny and CBO projections at CBO.gov.
What did Moody’s downgrading the US credit rating mean?
On May 16, 2025, Moody’s downgraded the US sovereign credit rating from Aaa (the highest possible) to Aa1 — joining S&P (2011) and Fitch (2023) in removing the US from the AAA tier. Moody’s cited concerns over a federal budget deficit expected to reach nearly 9% of GDP and debt ratios “significantly higher than similarly rated sovereigns.” The immediate market reaction pushed the 30-year Treasury yield briefly above 5% and the 10-year to 4.56% before markets stabilized. The more lasting consequence is the term premium — the structural component of Treasury yields that investors demand to compensate for long-duration fiscal risk — which is now adding approximately 75 basis points to 10-year yields on a sustained basis.
How does rising US debt affect mortgage rates?
The connection is direct. Mortgage rates are priced as a spread over the 10-year Treasury yield. When the government issues more debt, it must offer higher yields to attract buyers, pushing Treasury yields up and mortgage rates up with them. CBO projects the 10-year Treasury yield at 4.1% in 2026, rising to 4.4% by 2031 — a structural floor for the borrowing environment. At current debt issuance volumes ($7+ trillion in gross annual Treasury issuance), the market’s absorption of government bonds structurally elevates long-term rates above where Fed policy alone would set them. The current 6.5% mortgage rate reflects both Fed policy and this fiscal crowding-out effect.
Could the US default on its debt?
No — for a legally and structurally distinct reason. The US issues debt in its own currency and its central bank (the Federal Reserve) can create dollars. This makes explicit default — refusing to pay — essentially impossible as long as dollar sovereignty exists. The more realistic risks are: (1) a debt ceiling confrontation that causes a temporary technical default, which would be immediately resolved; (2) inflation-driven “soft default” where the government inflates away the real value of its obligations; or (3) a sharp currency depreciation that reduces the real burden of dollar-denominated debt at the cost of purchasing power. None of these is “default” in the conventional sovereign bankruptcy sense — but all impose costs on dollar holders.
What would it take to stabilize the US debt-to-GDP ratio?
The primary deficit — government spending minus revenue, excluding interest payments — needs to be reduced to near zero or turned into a surplus for the debt-to-GDP ratio to stabilize. Currently, primary deficits are projected at approximately 2% of GDP annually over the long term. The AAF estimates that stabilizing Social Security alone requires either a 29% payroll tax increase or a 22% benefit cut. For the overall federal budget, the combination of options includes some mix of revenue increases (tax hikes or base broadening), spending reductions (entitlement reform, discretionary cuts), and growth-enhancing policies. No single lever is sufficient — and no credible political coalition for the combination currently exists in Washington.
What investments protect against rising US debt consequences?
The fiscal trajectory creates two primary portfolio risks: structurally elevated interest rates and elevated long-run inflation risk. The assets that hedge these risks most reliably:
- TIPS (Treasury Inflation-Protected Securities) — real yields of 1.25%–2.0% plus automatic CPI adjustment; available via TreasuryDirect.gov or TIP/VTIP ETFs
- Gold — central banks are buying at record pace (244 tonnes in Q1 2026) specifically because of the fiscal deterioration thesis; access via GLD or IAU ETFs
- Short-duration Treasuries — 1–2 year T-bills and notes capture elevated short-term yields without the capital loss risk of long-duration bonds
- I Bonds — $10,000/year per person at TreasuryDirect.gov, currently yielding 4.03% with automatic CPI adjustment
- International equities — diversification away from US-centric portfolios reduces concentration in the fiscal trajectory’s principal victim
Where can I track US debt and fiscal projections in real time?
Primary sources, all free and authoritative:
- CBO Long-Term Budget Outlook 2026 — the definitive 10-year projection from the nonpartisan Congressional Budget Office
- CRFB Deficit Tracker — Committee for a Responsible Federal Budget’s real-time analysis
- Treasury Fiscal Data — Debt to the Penny — daily official debt figure
- Brookings Federal Budget Update — quarterly independent fiscal analysis
- J.P. Morgan — Five Scenarios for Federal Debt — scenario analysis including policy variations
- FRED — Federal Debt as % of GDP — historical context from the St. Louis Federal Reserve
Sources: CBO Budget and Economic Outlook 2026–2036 · CRFB — Debt Rises to 175% of GDP, March 2, 2026 · Brookings — Federal Budget Outlook, March 12, 2026 · J.P. Morgan — Five Scenarios for Federal Debt, May 2026 · Al Jazeera — CBO Fiscal Outlook, February 11, 2026 · Conference Board — CBO 2026–2036 Analysis · American Action Forum — Consequences of High Debt, December 2025 · Econofact — Federal Debt and Fiscal Crisis Risk, 2026 · RSM — Moody’s Downgrade and Term Premium, May 2025 · CNBC — Moody’s Downgrade Impact, May 19, 2025
© Fact and View, 2026. For informational purposes only. Not investment advice.


Be First to Comment