When markets turn volatile, a familiar piece of advice resurfaces every time: buy stocks that pay dividends. It sounds simple. It isn’t quite that simple in practice — because not every dividend-paying company survives a downturn with its payout intact, and the difference between a resilient dividend stock and a fragile one is almost never visible from the yield number alone.
During the 2008 financial crisis, the broad U.S. stock market fell roughly 37% for the year, with a peak-to-trough decline near 55%. A specific group of dividend-paying companies — those with at least 25 consecutive years of raising their payouts — fell only about 22% over that same year, while continuing to increase their dividends throughout the crisis. That gap wasn’t luck. It reflected something structural about how these businesses were built, financed, and managed long before the crisis ever began.
This guide explains exactly what separates a genuinely recession-resistant dividend stock from one that merely looks safe — and how to tell the difference before the next downturn arrives, not after.
Why Not All Stocks That Pay Dividends Are Created Equal
The phrase “dividend stock” covers an enormous range of businesses, from ultra-stable consumer goods giants to highly leveraged energy producers to real estate trusts carrying significant debt. Lumping them together as one category is the first mistake most beginning income investors make.
Fact: A dividend yield — the annual payout divided by the share price — tells you nothing on its own about whether that payout is sustainable. A company can maintain an attractive yield right up until the moment it announces a cut, because the yield calculation doesn’t account for whether the underlying cash flow can actually support the payment.
Fact: According to S&P Dow Jones Indices research, portfolios that combined dividend yield analysis with free cash flow yield analysis — screening out companies whose dividends weren’t backed by real cash generation — outperformed the broader market by roughly 6 percentage points annually. The yield alone wasn’t the differentiator. The cash flow behind the yield was.
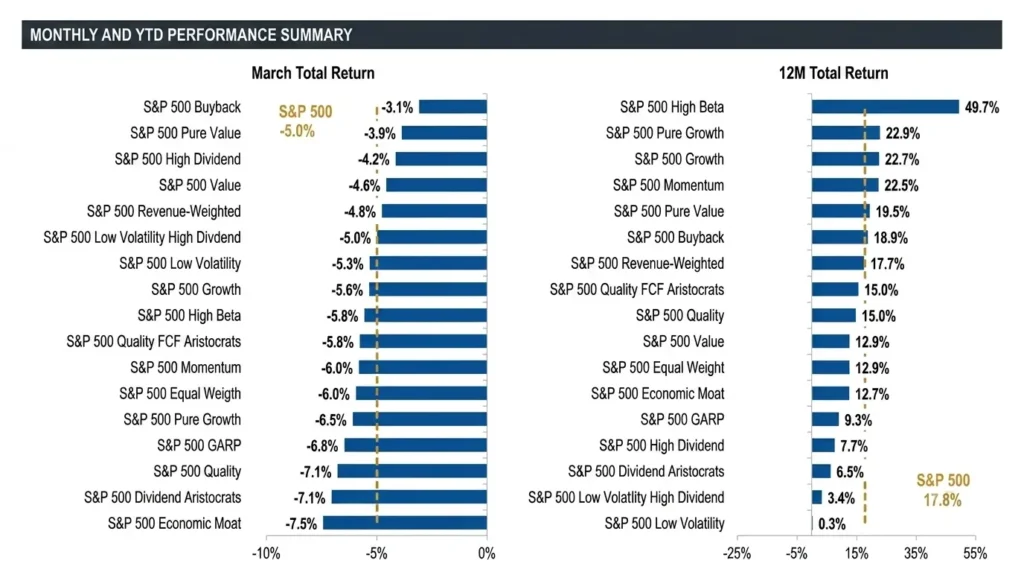
The View: Recession resistance in dividend investing isn’t really about finding stocks with the highest yields. It’s closer to the opposite — the highest-yielding dividend stocks are frequently the ones the market is quietly pricing for a future cut. The stocks that actually survive downturns tend to have moderate, well-covered yields attached to unglamorous, essential businesses. That distinction is the entire foundation of everything that follows.
Related reading: Best Investments During Inflation — how dividend-paying equities fit alongside other defensive assets like TIPS and gold in a broader portfolio strategy.
What Actually Happens to Dividend Stocks in a Recession
The clearest evidence on dividend resilience comes from examining what actually happened to specific companies during the two worst U.S. downturns of the past two decades: 2008 and 2020.
The Dividend Aristocrats case study. The S&P 500 Dividend Aristocrats — a formally defined index of S&P 500 companies that have increased their dividend every single year for at least 25 consecutive years — declined approximately 22% in 2008, versus a 37% decline for the broader S&P 500. That roughly 15-percentage-point cushion, in a single crisis year, illustrates the practical value of the screening criteria: sustained dividend growth requires a level of financial discipline that tends to correlate with broader business resilience.
Individual standouts tell an even sharper story. Walmart was the only Dividend Aristocrat to deliver a positive total return during the Great Recession, while the S&P 500 lost roughly 55% peak to trough. Walmart’s sales actually rose slightly during the crisis — a direct reflection of the fact that groceries account for roughly half its revenue, and consumers don’t stop buying groceries in a downturn.
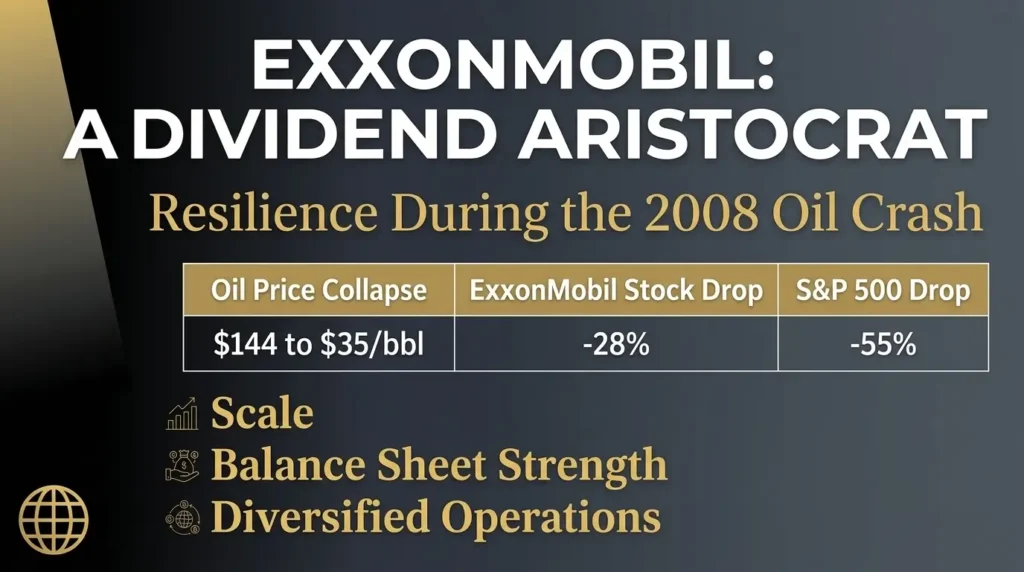
Even cyclical sectors have defensive standouts. ExxonMobil is one of only a handful of Dividend Aristocrats in the energy sector — a notoriously volatile industry tied to swings in oil prices. When oil collapsed from roughly $144 a barrel in mid-2008 to under $35 a barrel five months later, ExxonMobil’s stock fell only about 28%, compared to the S&P 500’s roughly 55% peak-to-trough decline. Scale, balance sheet strength, and diversified operations across the entire oil value chain — from extraction to refining to chemicals — cushioned the blow in a way smaller, single-segment energy companies couldn’t replicate.
Consumer staples as a sector consistently outperform. During periods of broad market stress, the consumer staples sector — companies selling food, household products, and personal care items — has repeatedly shown smaller drawdowns than the overall market, reflecting simple economic logic: people keep buying toothpaste, laundry detergent, and packaged food regardless of what the stock market or the unemployment rate is doing.
Related reading: Where Smart Money Is Moving Right Now — how institutional investors position portfolios defensively ahead of anticipated volatility.
The Dividend Aristocrats Framework: A Starting Point, Not a Guarantee
The Dividend Aristocrats index provides a useful, rules-based starting point for identifying candidates, precisely because its membership criteria filter out the majority of the market automatically.
Fact: To qualify as a Dividend Aristocrat, a company must be a member of the S&P 500, must have increased its dividend every year for at least 25 consecutive years, and must meet minimum market capitalization and liquidity requirements. Only a small fraction of S&P 500 companies — currently a few dozen — have ever met this bar. Communications is the only major sector with no representation at all in the index, reflecting how few telecom and media companies have maintained that level of consistency.
Fact: The list is not static, and removals are instructive. Companies including AT&T, General Electric, 3M, and Walgreens have all been removed from the Dividend Aristocrats index after cutting their dividends — a reminder that even decades of consistency don’t guarantee the future, particularly when a company’s core business model comes under structural pressure.
Fact: Academic and industry research shows Dividend Aristocrats have historically outperformed the broader market by roughly 2 percentage points annually over multi-decade periods, with the majority of that outperformance concentrated specifically in down markets and bear-market years — including the 2000–2002 downturn, the 2007–2009 financial crisis, and the 2022 bear market. Notably, the same research shows these stocks have periodically lagged the broader market during strong bull runs led by high-growth sectors, since defensive, dividend-paying businesses rarely lead technology-driven rallies.
The View: Treat the Aristocrats list as a well-vetted starting universe, not an automatic buy list. The screening criteria — 25 years of consecutive increases — filters out businesses that can’t sustain financial discipline through multiple economic cycles, but it can’t predict the next structural disruption to a specific industry. The AT&T, GE, and Walgreens removals all happened to companies that, at the time they joined the index, looked just as durable as the ones still on it today.
Related reading: Is the Stock Market Overvalued? — understanding broad market valuation context helps determine when dividend stocks offer genuine relative value versus growth alternatives.
How to Evaluate Whether a Dividend Is Actually Safe
Beyond relying on a pre-built index, individual investors can apply the same analytical framework professional analysts use to stress-test any dividend-paying stock before buying it.
1. Check the Payout Ratio — Then Check It Again Using Cash Flow
- Earnings-based payout ratio = Dividends paid ÷ Net income. A ratio below roughly 60% is generally considered comfortable; above 75% is typically flagged as a warning sign, since there’s little cushion if earnings dip.
- Free cash flow payout ratio = Dividends paid ÷ Free cash flow (operating cash flow minus capital expenditures). This is the more reliable of the two, because earnings can be distorted by non-cash accounting items — depreciation, stock-based compensation, one-time charges — that have nothing to do with the actual cash sitting in a company’s bank account. A company can report solid earnings while its free cash flow tells a much weaker story.
Fact: A company reporting, for example, $4 in earnings per share and $2.50 in free cash flow per share, while paying out $2 in dividends, would show a comfortable 50% earnings-based payout ratio — but an 80% free cash flow payout ratio, which is a meaningfully tighter margin of safety. The two numbers can tell very different stories about the same dividend.
2. Calculate the Dividend Coverage Ratio
The coverage ratio is simply the inverse of the payout ratio — how many times over a company’s earnings or cash flow could cover its dividend obligation.
- A coverage ratio below 1.2x deserves real scrutiny, regardless of industry, because it signals almost no buffer against a downturn in earnings.
- A coverage ratio below 1.0x signals the dividend is being funded partly by debt or cash reserves rather than current profits — a pattern that is sustainable only until it isn’t.
- A coverage ratio of 1.5x or higher, particularly when measured against free cash flow, is generally treated as a reasonable floor for income-focused investors.
3. Examine Balance Sheet Strength
A company’s debt level relative to its assets is one of the most reliable long-term indicators of dividend durability. Heavy debt loads increase interest expense, reduce financial flexibility during downturns, and — critically — creditors get paid before shareholders. A highly leveraged company facing a revenue decline will often prioritize debt service over its dividend, because failing to do the former can trigger default, while cutting the latter merely disappoints shareholders.
4. Look for a Consistent, Multi-Cycle Track Record
A dividend that has been raised every year through at least one full recession — ideally two — has been stress-tested in a way that a five-year growth streak simply hasn’t. This is precisely the logic behind the 25-year Dividend Aristocrats threshold: it’s long enough to have survived the dot-com crash, the 2008 financial crisis, and the 2020 pandemic shock.
5. Watch for the Warning-Sign Combination
Fact: Financial research analyzing patterns that preceded historical dividend cuts found that no single metric reliably predicts a cut in isolation. But a specific combination — a rising payout ratio, combined with declining free cash flow, combined with increasing debt levels, combined with insider selling — has preceded roughly 78% of dividend cuts within the following 12 months. It’s the convergence of warning signs, not any single one, that matters most.
Which Sectors Tend to Hold Up Best
Sector selection does much of the defensive work before you even evaluate an individual company.
- Consumer staples — food, beverages, household and personal care products — benefit from consistent demand regardless of economic conditions.
- Healthcare — prescription drugs, medical devices, and essential health services see relatively stable demand through economic cycles, since people don’t defer necessary medical care simply because a recession has started.
- Utilities — regulated electric, gas, and water providers benefit from consistent, largely inelastic demand and often operate under rate structures designed to guarantee a stable return.
- Discount retail — as Walmart’s 2008 performance demonstrates, some retailers actually benefit during downturns as cost-conscious consumers trade down from pricier alternatives.
By contrast, cyclical sectors — traditional energy, financials, industrials, and discretionary retail — tend to see sharper earnings volatility during recessions, which flows directly into greater dividend risk, even among otherwise well-run companies within those sectors.
Related reading: How Beginners Should Invest — building a diversified portfolio foundation that balances dividend income with long-term growth exposure.
The Trade-Off Every Income Investor Should Understand
Recession-resistant dividend stocks are not a free lunch, and being clear-eyed about the trade-off matters as much as understanding the benefits.
The defensive positioning that protects capital during downturns is the same characteristic that tends to cause underperformance during strong bull markets, particularly those led by high-growth sectors. Research comparing the Dividend Aristocrats index to the broader S&P 500 shows periods — including recent multi-year bull runs led by technology — where the defensive index trailed the broader market significantly, precisely because its constituents are deliberately weighted toward stability over rapid growth.
This isn’t a flaw in the strategy. It’s the mechanical trade-off that produces the downside protection in the first place. An investor who wants both — meaningful downside cushioning during recessions and full participation in growth-led bull markets — is generally better served by combining a core allocation to defensive dividend payers with a separate allocation to growth-oriented holdings, rather than expecting one category of stock to deliver both.
FAQ
What makes a dividend stock “recession-proof”?
No dividend stock is entirely immune to a recession, but the most resilient ones share common traits: consumer staples, healthcare, or utility businesses with consistent demand; free cash flow that comfortably covers the dividend (ideally 1.5x or higher); low debt relative to assets; and typically at least one full economic cycle, and ideally 25 years or more, of maintained or growing payouts.
Is a high dividend yield a good sign?
Not necessarily — and it’s often the opposite. An unusually high yield frequently reflects a falling stock price that the market is pricing in anticipation of a future dividend cut, rather than a genuinely generous payout. Always check the payout ratio and free cash flow coverage before assuming a high yield is a bargain.
What’s the difference between dividend yield and dividend safety?
Yield measures how much income you receive relative to the share price today. Safety measures whether the company can sustain that payment through an economic downturn. A stock can have a modest yield and excellent safety, or a high yield and poor safety — the two metrics are largely independent of each other.
Do Dividend Aristocrats always outperform during recessions?
Historically, yes, as a group — they’ve shown smaller average declines than the broader market in every major downturn since the index’s 1989 inception, including 2000–2002, 2008, and 2022. But individual outperformance isn’t guaranteed for every constituent, and several former Aristocrats have been removed from the index after cutting their dividends.
Should retirees rely primarily on dividend stocks for income?
Many retirement-focused investors use dividend-paying stocks as one component of a broader income strategy, valuing their combination of current income and long-term growth potential. However, most financial planners recommend diversifying across dividend stocks, bonds, and other income sources rather than concentrating retirement income in equities of any kind, given that even defensive stocks carry more volatility than fixed-income alternatives.
How often should I re-check a dividend stock’s safety?
At minimum, after every quarterly earnings report, since payout ratios and free cash flow figures update with each release. Reviewing debt levels and any changes to a company’s dividend growth streak on an annual basis is generally sufficient for long-term holdings, barring a significant company-specific event.
The Bottom Line
Finding genuinely recession-resistant stocks that pay dividends comes down to looking past the yield and examining what’s actually funding it. A payout ratio comfortably below common warning thresholds, free cash flow coverage of at least 1.5 times the dividend, a manageable debt load, and a multi-decade track record of maintaining or growing the payout through at least one prior recession — these are the factors that separate durable dividend income from a payout that looks appealing until the moment it isn’t.
The 2008 financial crisis remains the clearest real-world demonstration available: a group of disciplined, dividend-growing companies fell roughly 15 percentage points less than the broader market, while continuing to raise their payouts throughout the worst year of the crisis. That outcome wasn’t accidental. It was the direct, measurable result of the underlying financial discipline this guide has walked through — discipline that investors can screen for themselves, in any market environment, using the same tools professional analysts rely on.
Continue reading from Fact and View:
- Best Investments During Inflation — how dividend equities complement TIPS, gold, and real assets in an inflation-resistant portfolio
- How Beginners Should Invest — building a diversified foundation that balances income, growth, and risk
- Is the Stock Market Overvalued? Full Breakdown — understanding market valuation context for timing new dividend stock purchases
Sources: Sure Dividend — Dividend Aristocrats List · Three Streams Financial — Dividend Aristocrats and Market Volatility · DividendCalculator.net — Dividend Aristocrats Complete List · Simply Safe Dividends — Top Recession-Proof Dividend Aristocrats · S&P Global — 20 Years of S&P 500 Dividend Aristocrats · Wikipedia — S&P 500 Dividend Aristocrats · Seeking Alpha — Dividend Aristocrat Performance During Financial Crisis · Capitally — How to Evaluate Dividend Stocks: 6 Key Metrics · Odalite — Free Cash Flow: The Best Metric for Dividend Sustainability · Equity Income and Dividends — Free Cash Flow Tests for Dividend Safety · DividendPro — Dividend Safety Scores & Cut Prediction · Dave Ahern — How to Evaluate Dividend Safety Using Financial Statements
© Fact and View. For informational purposes only. Not investment advice. Always consult a qualified financial advisor before making investment decisions.



Be First to Comment